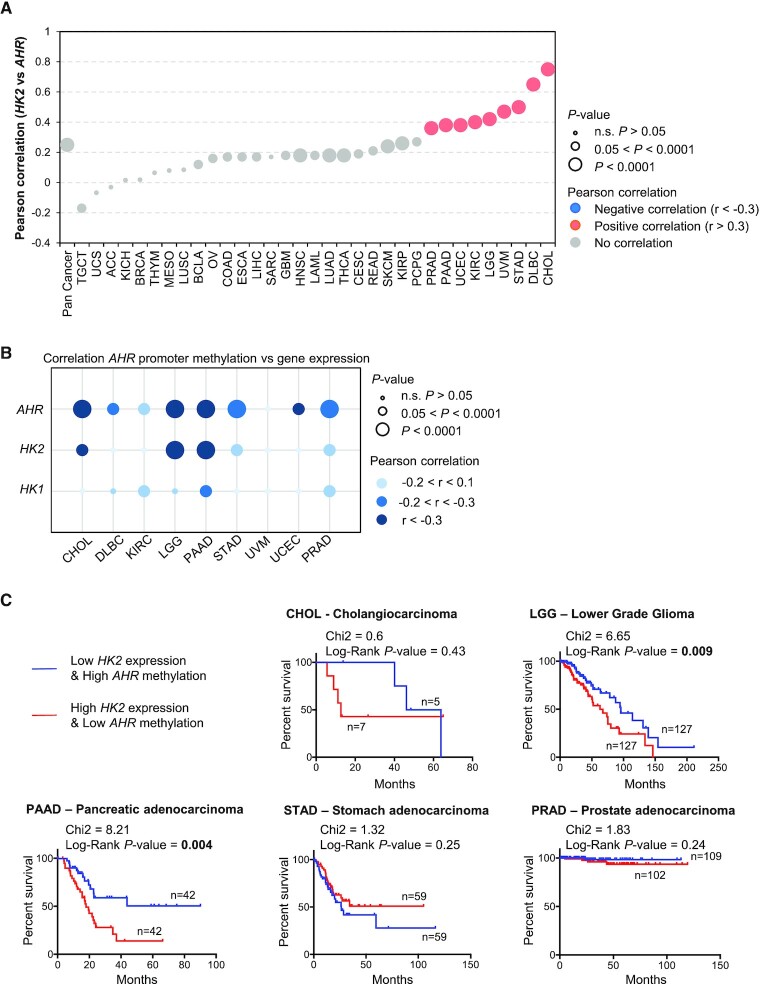
Figure 6.
Relationship between the expression of HK2 and the methylation of AHR promoter in cancer. (A) Relationship between the expression levels of HK2 and AHR retrieved in 33 different types of cancer from the TCGA. Significant correlation, Pearson r coefficient >0.3 or <–0.3 are indicated in colours (blue, negative correlation; salmon, positive correlation) (B) Relationship between the expression levels of AHR, HK2 and HK1 and the methylation level of AHR promoter in cancers. (C) Prognostic value of the AHR/HK2 axis in five different types of cancer exhibiting a negative correlation between HK2 expression and AHR promoter methylation.

