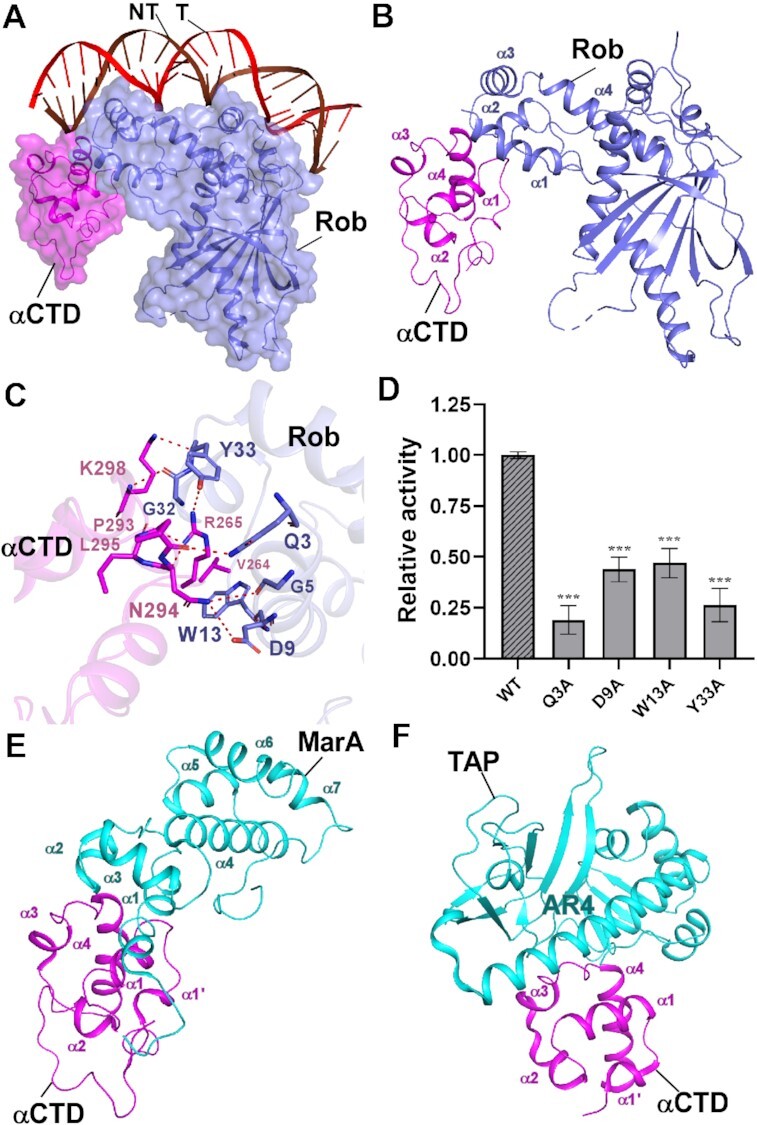
Figure 2.

The interactions between Rob and RNAP αCTD. (A) Relative locations of Rob, E. coli RNAP αCTD, and the upstream double-stranded DNA. (B) Rob interacts with E. coli RNAP αCTD. (C) Detailed interactions between E. coli RNAP αCTD and Rob. Salt-bridges are shown as red dashed lines. (D) Substitutions of Rob residues involved in interactions with E. coli RNAP αCTD decreased in vitro transcription activity. Data for in vitro transcription assays are means of three technical replicates. Error bars represent ± SEM of n = 3 experiments. Asterisk (***) indicates highly significant (P value < 0.001) difference from the wild-type Rob analyzed by one-way ANOVA with Tukey's multiple comparison test, respectively. (E) Interface between E. coli MarA and RNAP αCTD (PDB ID: 1XS9). (F) Interface between T. thermophilus TAP (transcription activator protein TTHB099) and T. thermophilus RNAP αCTD (PDB ID: 5I2D).
