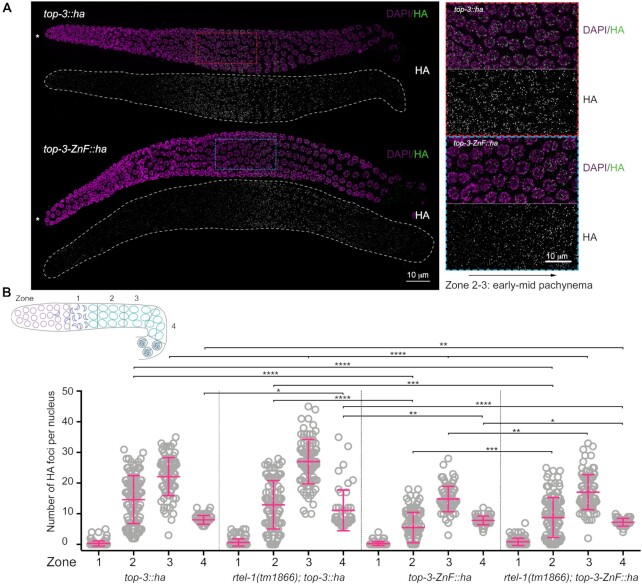
Figure 3.
top-3-ZnF localizes to foci. (A) Representative images of top-3::ha (top) and top-3-ZnF::ha (bottom) gonads stained with HA (green) and DAPI (magenta). * Indicates the distal tip of the progenitor zone. Red and blue squares (dashed lines) indicate the enlarged regions on the right. (B) Schematic representation of the C. elegans gonad divided into four equal zones from the transition zone to late pachynema. Scatter plots show the number of HA foci per nucleus in the meiotic region of the gonad: zone 1 = transition zone; zone 2 = early pachynema; zone 3 = mid pachynema; and zone 4 = late pachynema. For each genotype, the mean ± SD number of foci in each zone are indicated, with n = the number of nuclei assessed. top-3::ha: zone 1, 0.3 ± 0.8, n = 141; zone 2, 14.7 ± 7.8, n = 110; zone 3, 22.1 ± 6.2, n = 89; and zone 4, 8 ± 1.4, n = 71. rtel-1(tm1866); top-3::ha zone 1, 0.7 ± 1.2, n = 141; zone 2, 12.9 ± 7.9, n = 98; zone 3, 27.1 ± 7.3, n = 88; and zone 4, 11.1 ± 6.6, n = 49. top-3-ZnF::ha: zone 1, 0.3 ± 0.6, n = 121; zone 2, 5.5 ± 5, n = 92; zone 3, 14.8 ± 4.1, n = 83; and zone 4, 7.8 ± 1.4, n = 63. rtel-1(tm1866); top-3-ZnF::ha: zone 1, 0.9 ± 1.2, n = 132; zone 2, 8.8 ± 6.5, n = 117; zone 3, 17.1 ± 5.7, n = 94; and zone 4, 7.2 ± 1.2, n = 45. Error bars indicate the mean and SD. Statistical significance was determined using the Mann–Whitney test (see Supplementary table 1 for more details of the statistical analysis).

