Figure 4.
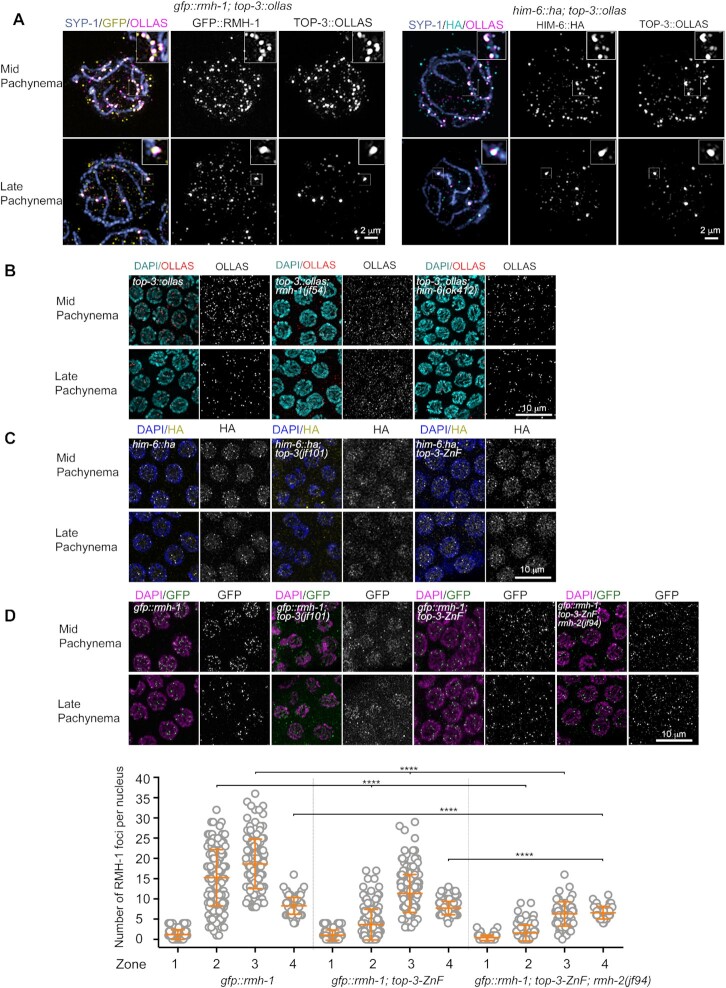
The TOP-3-ZnF domain influences localization of the BTR complex. (A) Super-resolution images of gfp::rmh-1; top-3::ollas (left) and him-6::ha; top-3::ollas (right) nuclei in mid pachynema (top) and late pachynema (bottom). Nuclei were stained with anti-SYP-1 (blue), anti-GFP (yellow) and anti-OLLAS (magenta) antibodies (left) and with anti-SYP-1 (blue), anti-HA (cyan) and anti-OLLAS (magenta) antibodies (right). Half part of the nucleus was projected. Insets (top, right) show magnified boxed regions, highlighting co-localization of the proteins. (B) TOP-3::OLLAS localization in mid pachynema (top) and late pachynema (bottom) in the indicated genotypes. Gonads were stained with DAPI (cyan) and anti-OLLAS antibody (red). (C) HIM-6::HA localization in mid pachynema (top) and late pachynema (bottom) in the indicated genotypes. Gonads were stained with DAPI (blue) and anti-HA antibody (yellow). (D) Upper panel: GFP::RMH-1 localization in mid pachynema (top) and late pachynema (bottom) in the indicated genotypes. Gonads were stained with DAPI (magenta) and anti-GFP antibody (green). Lower panel: quantification of GFP::RMH-1 foci in the meiotic region of the C. elegans gonad. The scatter plot indicates the number of foci per nucleus: zone 1 = transition zone; zone 2 = early pachynema; zone 3 = mid pachynema; zone 4 = late pachynema. For each genotype, the mean ± SD number of foci in each zone are indicated, with n = the number of nuclei assessed. gfp::rmh-1: zone 1, 1.2 ± 1.2, n = 111; zone 2, 15.22 ± 6.9, n = 155; zone 3, 18.64 ± 6.1, n = 44; and zone 4, 8.3 ± 2.1, n = 92. gfp::rmh-1; top-3-ZnF: zone 1, 1.1 ± 1.3, n = 103; zone 2, 3.6 ± 3.8, n = 167; zone 3, 11.4 ± 4.7, n = 186; and zone 4, 7.7 ± 1.7, n = 114. gfp::rmh-1; top-3-ZnF; rmh-2: zone 1, 0.4 ± 0.7, n = 83; zone 2, 1.6 ± 3, n = 89; zone 3, 6.3 ± 3, n = 62; and zone 4, 6.6 ± 1.6, n = 47. **** P < 0.0001, as determined using the Mann–Whitney test; non-significant differences are not shown. (See Supplementary table 1 for more details of the statistical analysis).

