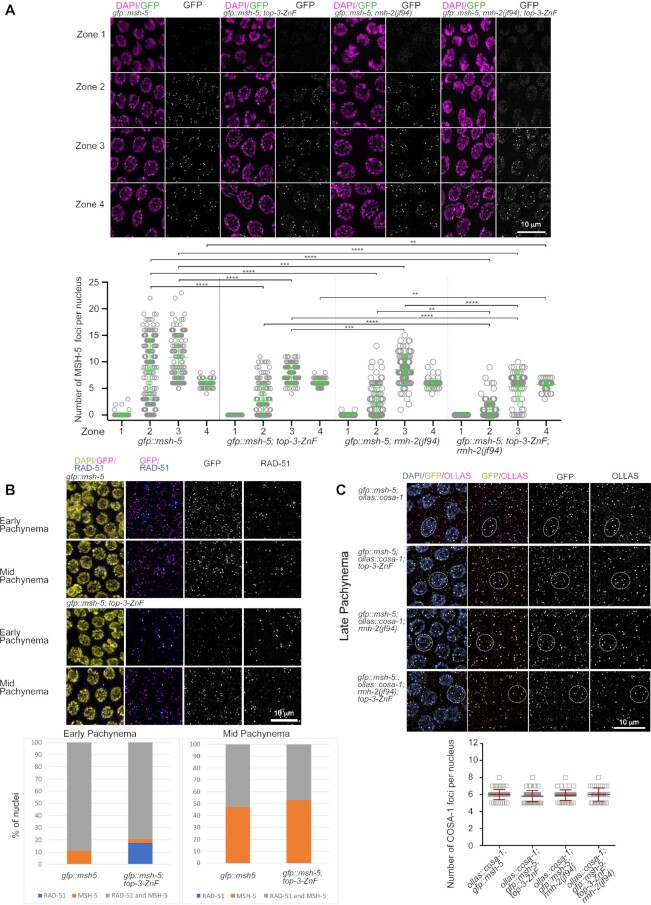
Figure 5.
Reduced loading of MSH-5 into recombination foci in top-3-ZnF and rmh-2. (A) Upper panel: representative images of GFP::MSH-5 foci localization at different stages of meiotic prophase I in C. elegans gonads of the indicated genotypes. Zone 1 = transition zone; zone 2 = early pachynema; zone 3 = mid pachynema; zone 4 = late pachynema. Images of gonads show DAPI staining (magenta) and endogenous GFP (green). Bottom: Quantification of GFP::MSH-5 foci in the meiotic part of the gonad. Scatter plots indicate the number of foci per nucleus. For each genotype, the mean ± SD number of foci in each zone are indicated, with n = number of nuclei assessed. gfp::msh-5: zone 1, 0.05 ± 0.3, n = 157; zone 2, 8.6 ± 5.8, n = 149; zone 3, 10.82 ± 4.2, n = 122; and zone 4, 6.1 ± 0.7, n = 92. gfp::msh-5; top-3-ZnF: zone 1, 0.0 ± 0.0, n = 151; zone 2, 2.7 ± 3.2, n = 135; zone 3, 7.3 ± 1.6, n = 133; and zone 4, 6.1 ± 0.7, n = 72. gfp::msh-5; rmh-2(jf94): zone 1, 0.02 ± 0.1, n = 125; zone 2, 2.2 ± 2.9, n = 107; zone 3, 8.5 ± 2.8, n = 93; and zone 4, 6 ± 0.8, n = 84. gfp::msh-5; top-3-ZnF; rmh-2(jf94): zone 1, 0 ± 0, n = 120; zone 2, 1 ± 1.7, n = 110; zone 3, 5.3 ± 2.7, n = 70; and zone 4, 5.7 ± 0.8, n = 58. Statistical significance was determined using the Mann–Whitney test (see Supplementary table 1 for more details of the statistical analysis). (B) Upper panel: representative images of nuclei in early and mid pachynema in the indicated genotypes after staining for RAD-51 (blue), GFP (magenta) and DAPI (yellow). Lower panel: the percentage of nuclei in early and mid pachynema that were positive for the indicated meiotic markers (RAD-51 only, blue; MSH-5 only, orange; and both RAD-51 and MSH-5, gray). (C) Upper panel: representative images of GFP::MSH-5 and OLLAS::COSA-1 co-localization in recombination foci in late pachynema in the indicated genotypes. Gonads were stained with DAPI (blue), anti-GFP (yellow) and anti-OLLAS (magenta) antibodies. Dashed circles highlight nuclei with clear co-localization. Lower panel: quantification of OLLAS::COSA-1 foci in late pachynema in the indicated genotypes. The scatter plot indicates the number of foci per nucleus. Mean ± SD are indicated, n = number of nuclei assessed. ollas::cosa-1; gfp::msh-5, 6 ± 0.6, n = 63; ollas::cosa-1; gfp::msh-5; top-3-ZnF, 5.8 ± 0.7, n = 67; ollas::cosa-1; gfp::msh-5; rmh-2, 5.9 ± 0.6, n = 52; ollas::cosa-1; gfp::msh-5; top-3-ZnF; rmh-2, 6 ± 0.8, n = 41. There is no significant difference between the indicated genotypes. Statistical significance was determined using the Mann–Whitney test.

