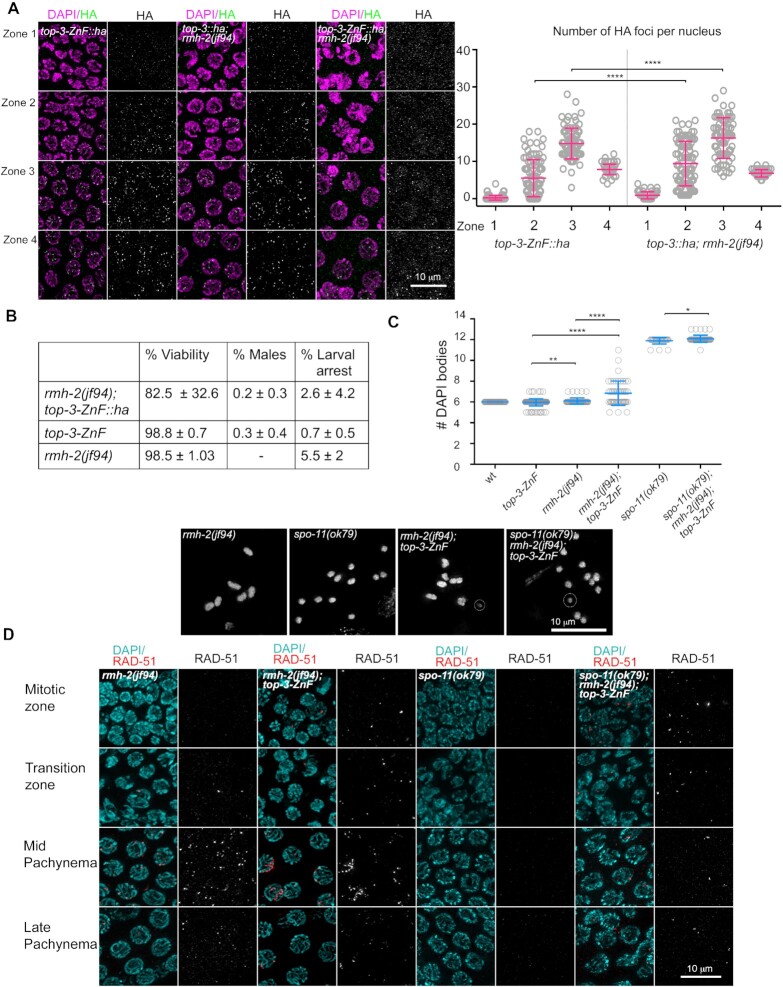
Figure 6.
top-3-ZnF and rmh-2 double mutants display a synthetic phenotype. (A) Representative images of gonads stained with HA (green) and DAPI (magenta) in the indicated genotypes. Zone 1 = transition zone; zone 2 = early pachynema; zone 3 = mid pachynema; zone 4 = late pachynema. Right panel: HA foci quantification in the indicated genotypes. The scatter plot indicates the number of foci per nucleus. Mean ± SD are indicated, n = number of nuclei assessed. top-3-ZnF::ha (same quantification as in Figure 3A): zone 1, 0.3 ± 0.6, n = 121; zone 2, 5.5 ± 5, n = 92; zone 3, 14.8 ± 4.1, n = 83; and zone 4, 7.8 ± 1.4, n = 63. top-3::ha; rmh-2: zone 1, 0.9 ± 0.9, n = 89; zone 2, 9.4 ± 6, n = 88; zone 3, 16.3 ± 5.4, n = 70; and zone 4, 7.4 ± 1.4, n = 48. **** P < 0.0001, as determined using the Mann–Whitney test; non-significant differences are not shown. top-3-Zn; rmh-2: no quantification owing to a lack of foci. (B) Percentage viability and rates of larval arrest and males in the indicated genotypes, with n = number of worms quantified per genotype: rmh-2(jf94); top-3-ZnF::han = 10; and top-3-ZnF = 17 (same as in Figure 1C); rmh-2(jf94)n = 9. (C) Quantification of DAPI bodies in the −1 diakinesis oocyte in the indicated genotypes: wt (same quantification as in Figure 1E) 6 ± 0, n = 50; top-3-ZnF, 5.96 ± 0.3, n = 154 (same quantification as in Figure 1E); rmh-2, 6.1 ± 0.3, n = 50; rmh-2; top-3-ZnF, 6.8 ± 1.2, n = 51; spo-11, 11.9 ± 0.3, n = 28; and spo-11; rmh-2; top-3-ZnF, 12.1 ± 0.3, n = 49. ** P = 0.0099, * P = 0.028, **** P < 0.0001, as determined using the Mann–Whitney test; non-significant differences are not shown. Insets show representative images of DAPI-stained diakinesis nuclei of the indicated genotypes. The dashed circles highlight fragments of DNA. (D) Representative images of RAD-51 foci localization at different stages of meiotic prophase I in the indicated genotypes. Gonads were stained with DAPI (cyan) and anti-RAD-51 antibodies (red).

