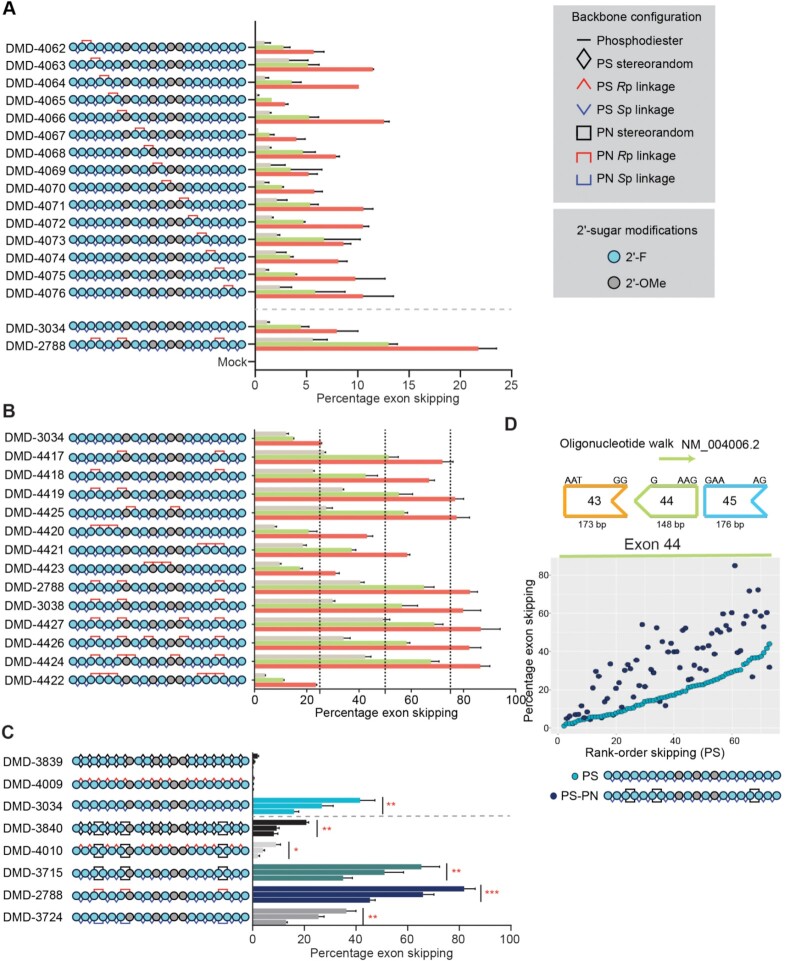
Figure 4.
Application of PN chemistry to exon skipping oligonucleotides. (A) Placement of PN linkages was evaluated by sequentially replacing each PS linkage with a stereopure PN linkage (Rp configuration). The resulting oligonucleotide series is shown on the left (legend for modifications is shown on right). The graph depicts percentage of exon 23 skipping detected after 4 days of treatment with 0.3 μM (beige), 1 μM (green), or 3 μM (red) of the indicated oligonucleotide (n = 2 per concentration per oligonucleotide). Data are represented as mean ± s.d. (B) Number and position of PN linkages was evaluated in the series of oligonucleotides. The graph depicts percentage of exon 23 skipping detected as shown in panel A. (C) Schematic representation of oligonucleotides evaluated (left). The graph depicts percentage of exon 23 skipping detected as shown in panel A. Dotted gray line separates data from oligonucleotides with and without PN-backbone linkages. Data are presented as mean ± s.e.m., n = 3. Two-way ANOVA with multiple comparisons: * P < 0.05, ** P < 0.01, *** P < 0.001. (D) Oligonucleotide walk across human DMD exon 44 to compare average exon-skipping activity (n = 2) in Δ48–50 primary human myoblasts for oligonucleotides with all-Sp PS backbone to those with inclusion of a few stereorandom PN linkages. PS oligonucleotides, which differ from each other in sequence, are ranked along the x axis with the most active oligonucleotides on the right. Sequence-matched PN-containing oligonucleotides are plotted at the same position (x axis) as their PS counterpart. The chemical modifications for the PS and PS-PN oligonucleotides are shown. DMI, 1,3-dimethylimididazolidine-2-imine

