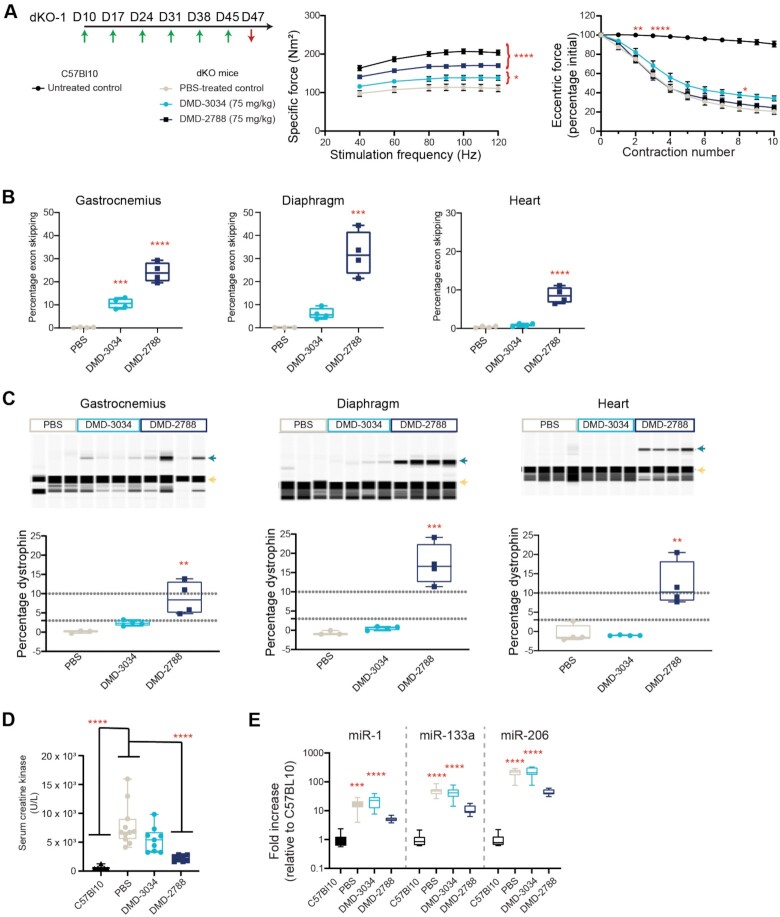
Figure 8.
DMD-3034 and DMD-2788 improve biomarker profiles and muscle function in dKO mice. (A) Schematic representation of weekly subcutaneous dosing regimen (75 mg/kg) for study dKO-1. First administration corresponds to 10-day old mice. Mice were dosed weekly (green arrows) for 6 weeks starting on day 10 of age and assessed for functional assays before sacrifice 2 days after the last injection (red arrow). Specific force (middle) production over increasing stimulation frequency and force drop as a percentage of initial eccentric force (right) following repeated contraction for C57Bl10 mice and dKO mice treated with PBS or the indicated oligonucleotide. Mean ± s.d., n ≥ 4. Two-way ANOVA with comparisons to PBS. * P < 0.05,** P < 0.01, ***P < 0.001, **** P < 0.0001. All significant differences increased or were maintained at later experimental points. For example, by contraction 3 (bottom), untreated C57Bl10 mice are significantly different from PBS-treated dKO mice (P < 0.0001), and this level of significance persists through the end of the experiment. (B) Percentage exon skipping measured in the gastrocnemius (left), diaphragm (middle), and heart (right) in dKO-1 study at day 47. Mean ± s.d., n = 4. ***P < 0.001, **** P < 0.0001. (C) Percentage dystrophin restoration measured in the same tissues as in panel B. Dystrophin quantification as shown in Supplementary Figure S2. Green arrow denotes dystrophin; yellow arrow, vinculin. (D) Serum creatine kinase levels for mice from dKO-1 study at day 47. Mean ± s.e.m., C57BL10 n = 6; dKO n = 8. (E) Serum miRNA levels for dKO-1 study at day 47. Mean ± s.e.m., C57Bl10 n = 6; dKO n = 8. Panels B–D: one-way ANOVA with comparison to PBS (B), PBS and C57Bl10 (C) or C57Bl10 (D), ** P < 0.01, *** P < 0.001, **** P < 0.0001.

