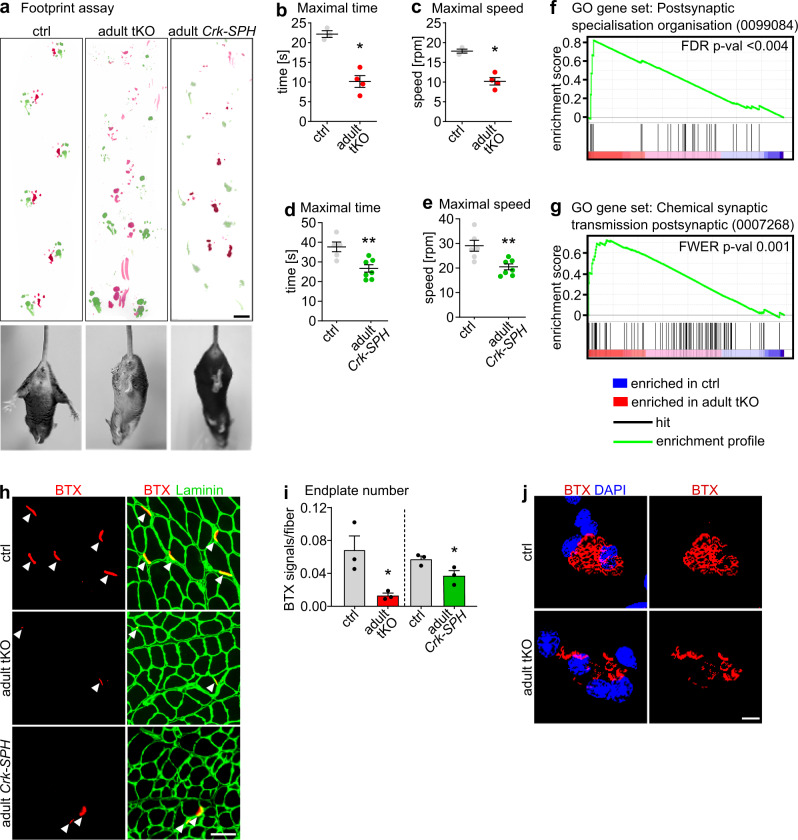
Fig. 7. Maintenance of NMJ in adult mice requires miR-1/206/133-dependent regulation of CRK.
a Adult miR-1/206/133 tKO (n = 4) and adult Crk-SPH (n = 3) show muscle weakness, abnormal locomotion in footprint assays, and hindlimb clasping during tail suspension (n = 3, control = miR-1-1/133a-2−/−//miR-1-2/133a-1lox/lox//miR-206/133b−/−//HSA-rtTA-TRE-Cre+/+ [control and tKO female ~44 weeks; adult Crk-SPH 13-16 weeks, females]). Scale-bar: 1 cm. b, c Adult miR-1/206/133 tKO (n = 4) show impaired motor function in Rotarod tests (n = 3, control = miR-1-1/133a-2−/−//miR-1-2/133a-1lox/lox//miR-206/133b−/−//HSA-rtTA-TRE-Cre+/+ [male, female, ~44 weeks]; Mann-Whitney-U test, one-tailed, *p = 0.0286). d-e Adult Crk-SPH mice show impaired motor functions in Rotarod tests (n = 6, control = CAG-LSL-dCas9-SPH+/+, n = 7 Crk-SPH animals [female, 13–16 weeks]; Mann-Whitney-U test, one-tailed, **p = 0.0051 (d), **p = 0.0029 (e)). f, g GSEA of adult miR-1/206/133 tKO (n = 3) and control (n = 2) TA (control = miR-1-1/133a-2−/−//miR-1-2/133a-1lox/lox//miR-206/133b−/−//HSA-rtTA-TRE-Cre+/+, familywise-error rate method (FWER), p = < 0.004 (f), false discovery rate (FDR) p = 0.001 (g) [male, ~44 weeks]). h, i Quantification of BTX-stained postsynaptic regions in TA transversal sections from adult miR-1/206/133 tKO (n = 3) and adult Crk-SPH (n = 3) mice in comparison to controls (n = 3, control of adult tKO= miR-1-1/133a-2−/−//miR-1-2/133a-1lox/lox//miR-206/133b−/−//HSA-rtTA-TRE- Cre+/+, [~44 weeks, male]; n = 3, control of Crk-SPH = HSA-rtTA-TRE-Cre+/+ or CAG-LSL-dCas9-SPH+/+[10–14 weeks, female], Mann-Whitney-U tests, one tailed, *p = 0.05). Scale-bar in r: 50 µm. j BTX staining (red) of isolated single myofibers of flexor digitorum brevis muscle from adult miR-1/206/133 tKO (n = 3) in comparison to controls (n = 3, control of adult miR-1/206/133 tKO = miR-1-1/133a-2−/−//miR-1-2/133a-1lox/lox//miR-206/133b−/−//HSA-rtTA-TRE- Cre+/+, [~44 weeks, male]). DAPI staining in blue. Z-stacks. Scale-bar: 20 µm. Source data are provided as a Source Data file. Data are presented as mean values +/− SEM in b–e and i.

