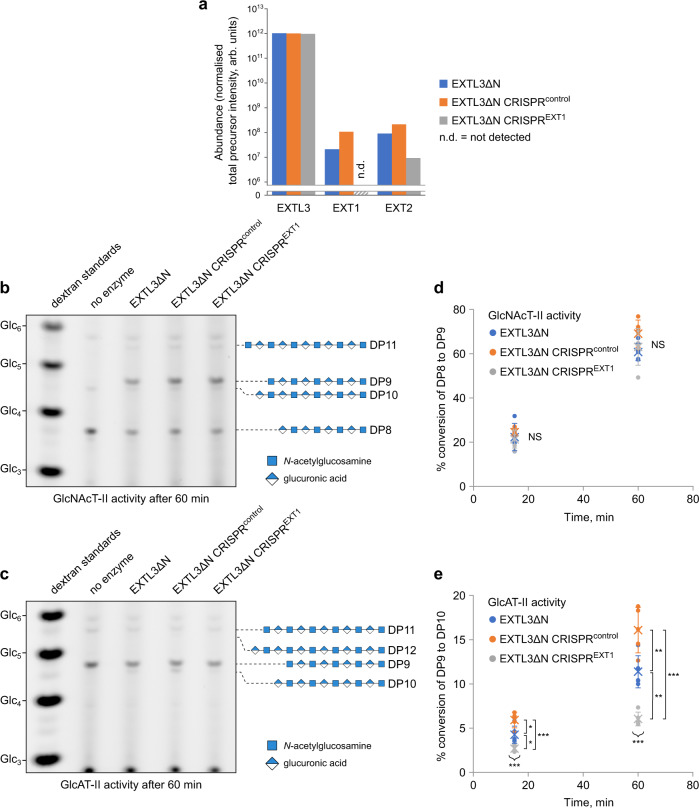
Fig. 2. The level of GlcAT-II activity in EXTL3∆N preparations exhibits substantial dependence on the level of EXT1 contamination.
EXTL3∆N was prepared from the culture medium of regular EXTL3∆N-expressing cells (EXTL3∆N), EXTL3∆N-expressing cells transfected with a non-specific CRISPR-Cas9 control construct (EXTL3∆N CRISPRcontrol), or EXTL3∆N-expressing cells transfected with a CRISPR-Cas9 construct targeting EXT1 (EXTL3∆N CRISPREXT1). a The relative abundance of EXTL3(∆N), EXT1, and EXT2 in the three different preparations was determined by mass spectrometry/label-free quantification. The lower limit of detection corresponds to approximately 106 arbitrary units. For numerical values, as well as the top ten most abundant proteins, see Supplementary Table 3. Each dataset was obtained from a single biological replicate. b–e Comparison of GlcNAcT-II and GlcAT-II activities of EXTL3∆N, EXTL3∆N CRISPRcontrol, and EXTL3∆N CRISPREXT1 preparation, visualised by PACE. For both activities, five independent assays were carried out using the same biological enzyme preparation (i.e. n = 5 technical replicates for each treatment) to account for potential technical variability. b, d GlcNAcT-II activity: DP8 acceptor was treated with enzyme in the presence of UDP-GlcNAc, MnCl2, and MgCl2. c, e GlcAT-II activity: DP9 acceptor was treated with enzyme in the presence of UDP-GlcA, MnCl2, and MgCl2. Reactions were then split in two; each half was terminated after 15 or 60 min, respectively. b, c Representative PACE gels for GlcNAcT-II and GlcAT-II 60 min time points, respectively. d, e Percentage substrate conversion at the two different time points was determined by densitometry. Dots represent individual measurements, crosses represent group means, and error bars represent standard error of the mean. Statistics: one-way ANOVA (two-tailed) with Tukey’s honest significant difference (HSD); NS no significant difference * p < 0.05, ** p < 0.01, *** p < 0.001. GlcNAcT-II ANOVA: F2,12 = 0.75, p = 0.49 (15 min); F2,12 = 2.23, p = 0.15 (60 min). GlcAT-II ANOVA: F2,12 = 21.09, p = 1.18 × 10⁻⁴ (15 min); F2,12 = 36.2, p = 8.29 × 10⁻⁶ (60 min). GlcAT-II Tukey’s HSD between EXTL3∆N (1), EXTL3∆N CRISPRcontrol (2), and EXTL3∆N CRISPREXT1 (3): p = 0.0149 (1~2), p = 0.0213 (1~3), p = 8.15 × 10⁻⁴ (2~3) (15 min); p = 0.0479 (1~2), p = 0.00187 (1~3), p = 5.6 × 10⁻⁶ (2~3) (60 min).

