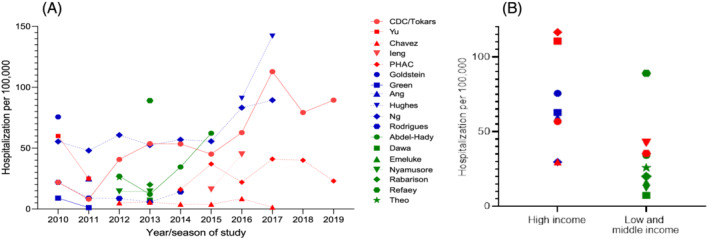
FIGURE 2.

Rates of hospitalization for adults aged 50–64 years or 45–64 years with laboratory‐confirmed influenza during the 2010–2011 to 2019–2020 influenza seasons. Red, blue, and green fill denote population‐based, ecologic, and SARI surveillance studies, respectively. Shapes represent different studies and lines connect data from different years in the same study. Figure 2A shows data by season over time; for studies providing only summary data over more than one season, 34 , 36 , 37 , 39 , 40 , 41 data are attributed to first year/season (if data for 2 years/seasons), the 2nd if 3 or 4 years/seasons. Figure 2B shows data by study type and World Bank country income classification. The overall average rate was used for studies that provided data for more than one season 24 , 25 , 27 , 32 , 33 , 35 , 42 , 43
