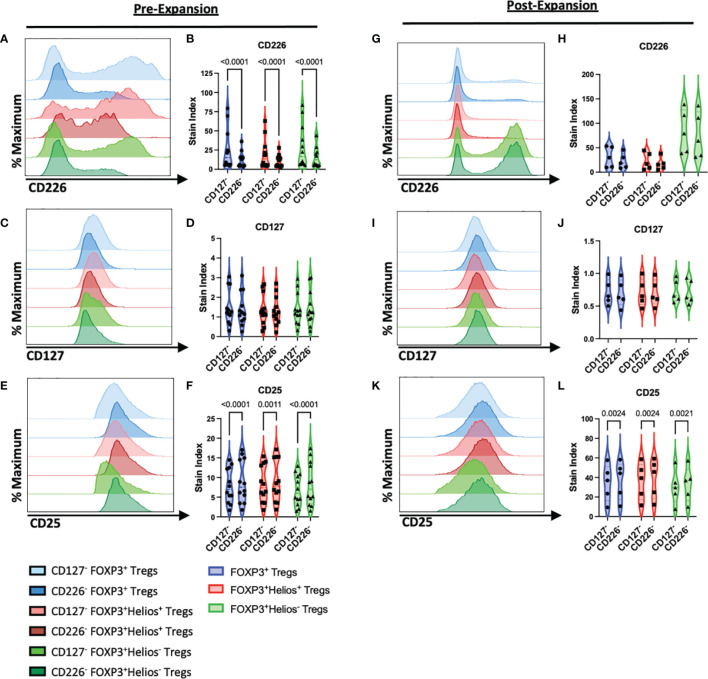
Figure 2.
CD4+CD25+CD226- Tregs Exhibit Increased CD25 Expression. Representative histograms show expression of cell surface markers on CD127lo/- (lighter blue) and CD226- CD4+CD25+FOXP3+ Tregs (darker blue), CD127lo/- (lighter red) and CD226- CD4+CD25+FOXP3+Helios+ Tregs (darker red), and CD127lo/- (lighter green) and CD226- CD4+CD25+FOXP3+Helios- Tregs (darker green) with violin plots showing stain index (SI) fold change from FMO controls, (A–F) prior to expansion (n =12 biological with n = 2 technical replicates) and (G–L) following 14 days of ex vivo expansion (n = 5 biological with n = 2 technical replicates). (A, B, G, H) CD226, (C, D, I, J) CD127, (E, F, K, L) CD25. Significant P-values are reported on the figure for two-way ANOVA with Bonferroni correction for multiple comparisons of Treg isolation conditions from matched subjects.

