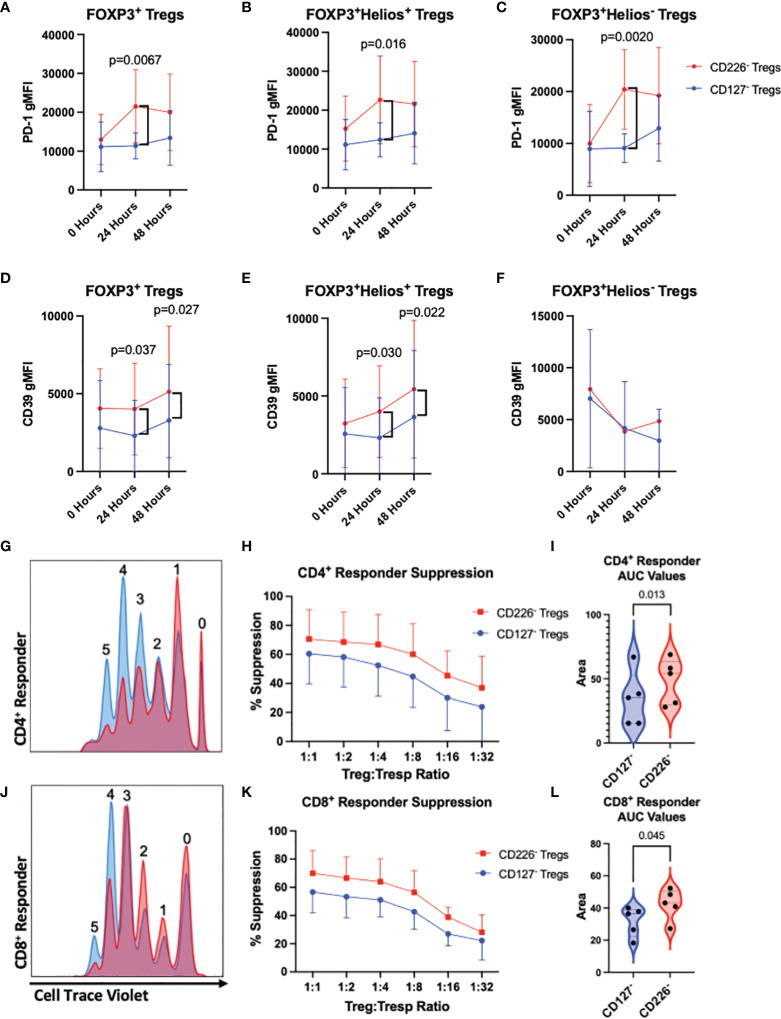
Figure 6.
CD226- Tregs demonstrate an increased suppressive phenotype and ex vivo suppressive capabilities as compared to CD127lo/- Tregs. (A–C) PD-1 and (D–F) CD39 expression was assessed by flow cytometry on total FOXP3+ Tregs (A, D), FOXP3+Helios+ Tregs (B, E), and FOXP3+Helios- Tregs (C, F) from 14-day ex vivo expanded CD127lo/- sorted Tregs versus CD226- Tregs following co-culture with autologous PBMCs in the presence of soluble α-CD3 and α-CD28 for 0, 24, or 48 hours. n = 5 biological replicates. Significant P-values reported on the figure for two-way ANOVA with Bonferroni’s multiple comparison between Treg isolation conditions of matched subjects. CD127lo/- sorted Treg (blue) and CD226- sorted Treg cultures (red) were by expanded for 14-days ex vivo, then labeled with Cell Proliferation Dye eFluor670 and co-cultured in decreasing two-fold dilutions with CellTrace Violet-labeled autologous responder PBMCs in the presence of soluble α-CD3 and α-CD28 antibodies for four days before flow cytometric assessment of (G–I) CD4+ and (J–L) CD8+ T cell proliferation. (G, J) Representative dye dilution plots demonstrating suppression of responders. Percent suppression of (H) CD4+ and (K) CD8+ responders was quantified by the division index method, and comparisons between FACS conditions were made using (I, L) area under the curve (AUC) values for each percent suppression curve (40, 41). Data reflects n = 5 biological with n = 3 technical replicates. Significant P-values are reported on the figure for paired T-tests comparing Treg isolation conditions from matched subjects.

