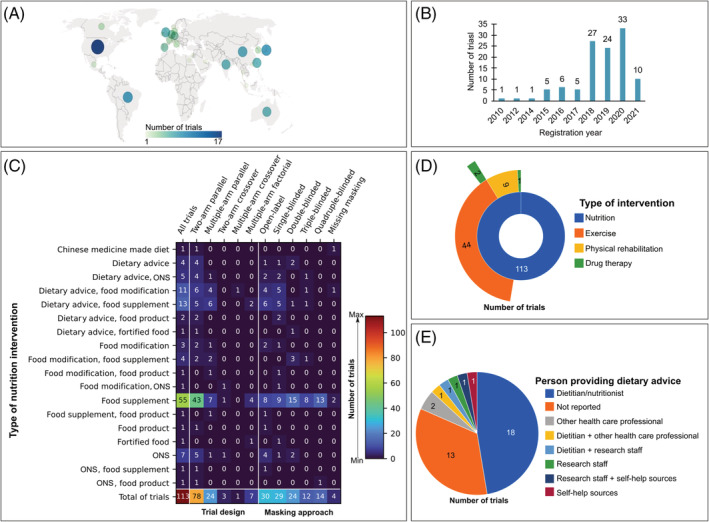
Figure 1.

Graphical summary of the overall characteristics of ongoing randomized controlled trials investigating the effects of nutrition interventions on muscle mass or function, sarcopenia, or cachexia (N = 113). Numbers are absolute counts. (A) Illustration showing the distribution of trials according to country of registration. As depicted above, the USA is the leading country in the number of registered trials (15.0% of all trials); Brazil (8.0%) and Japan (8.0%) appears as the second leading countries. (B) Bar graph reporting number of trials per year of registration. (C) Heat map illustrating number of trials stratified by type of nutrition intervention, study design, and masking approaches. Colours within the heat map range from dark blue (least frequency) to dark red (most frequency); total numbers of trials can be found in the bottom row. (D) Sunburst chart showing the distribution of trials (in absolute counts) in which nutrition interventions (inner ring) are combined with one (middle ring) or ≥2 co‐interventions (outer rings; multimodal interventions). (E) Pie chart depicting how dietary advice is provided in 38 trials. Numbers placed inside of each piece of rings (in D) or pies (in E) correspond to the number of trials being studied. ONS, oral nutritional supplement.
