
Figure 4.
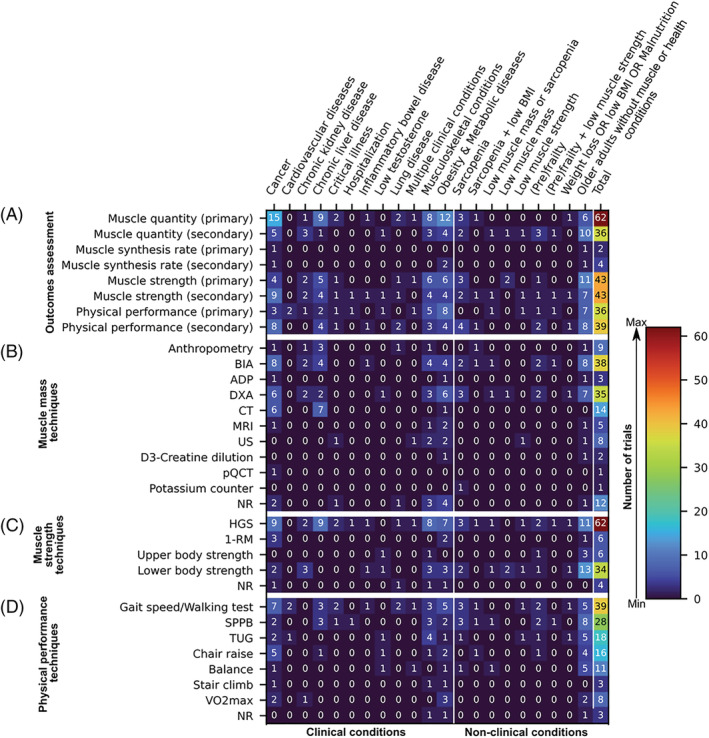
Heat map displaying outcome measures (y‐axis) of 113 ongoing randomized clinical trials studying the effects of nutrition interventions on muscle mass or function, sarcopenia, or cachexia. Trials are grouped by clinical and non‐clinical conditions (x‐axis). (A) Categories of muscle‐related outcomes (i.e. muscle quantity, muscle synthesis rate, muscle strength, and physical performance) stratified by types of outcomes (i.e. primary vs. secondary). (B) Anthropometric and body composition techniques being used to estimate outcomes related to muscle mass quantity. (C) Techniques being employed to evaluate muscle strength. (D) Methods commonly used to assess physical performance; note that different tests to evaluate gait speed and chair raise were grouped together for concision. Colours within the heat map range from dark blue (least frequency of trials) to dark red (most frequency of trials). Value in each cell is absolute count, and the last column of each figure panel depicts total counts. Note that some trials reported one or more concurrent primary or secondary outcomes. 1‐RM, one‐repetition maximum; ADP, air‐displacement plethysmography; BIA, bioelectrical impedance analysis; BMI, body mass index; CT, computed tomography; DXA, dual‐energy x‐ray absorptiometry; HGS, handgrip strength; MRI, magnetic resonance imaging; NR, not reported; pQCT, peripheral quantitative computed tomography; SPPB, Short Physical Performance Battery; TUG, timed up and go; US, ultrasound.