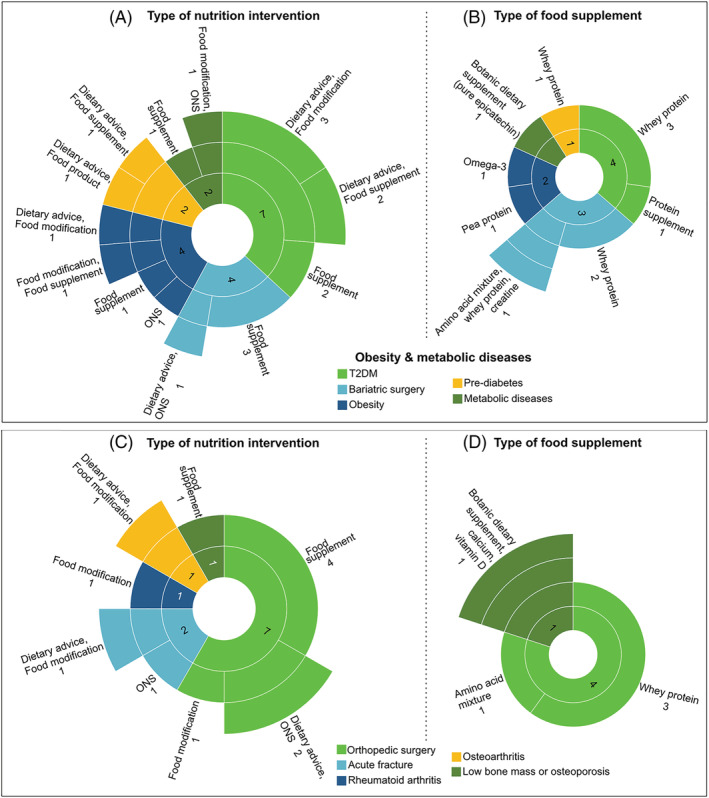
Figure 6.

Sunburst charts showing characteristics of interventions and distribution of trials across patients with obesity and metabolic diseases (A, B; n = 19 trials) as well as musculoskeletal conditions (C, D; n = 12). While the inner rings represent classes of conditions, middle and outer rings describe the types of nutrition interventions (A, C) and food supplements (B, D) that relates to each condition. Labels are placed outside of rings to describe these information and number of trials (in absolute counts). Numbers placed inside of each innermost piece of rings correspond to the total number of trials being studied in each condition. HMB, β‐hydroxy‐β‐methylbutyrate; ONS, oral nutritional supplement; T2DM, type 2 diabetes mellitus.
