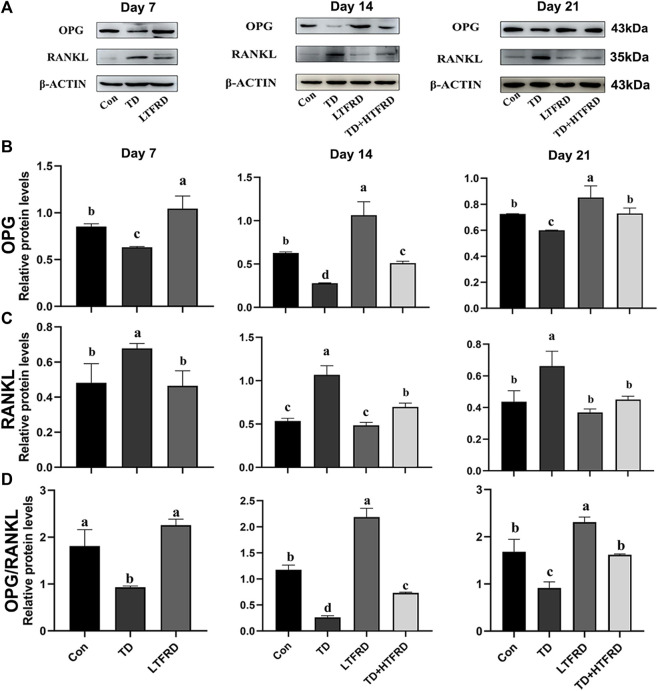
FIGURE 5.
Effects of LTFRD on OPG/RANKL protein level of tibial growth plate in TD broilers. (A) The gray scale analysis of OPG, RANKL and β-ACTIN. (B) The protein level of OPG. (C) The protein level of RANKL. (D) The protein level of OPG/RANKL The results are represented as mean ± SD. a, b, c, and d represent significant differences between groups (p < 0.05).

