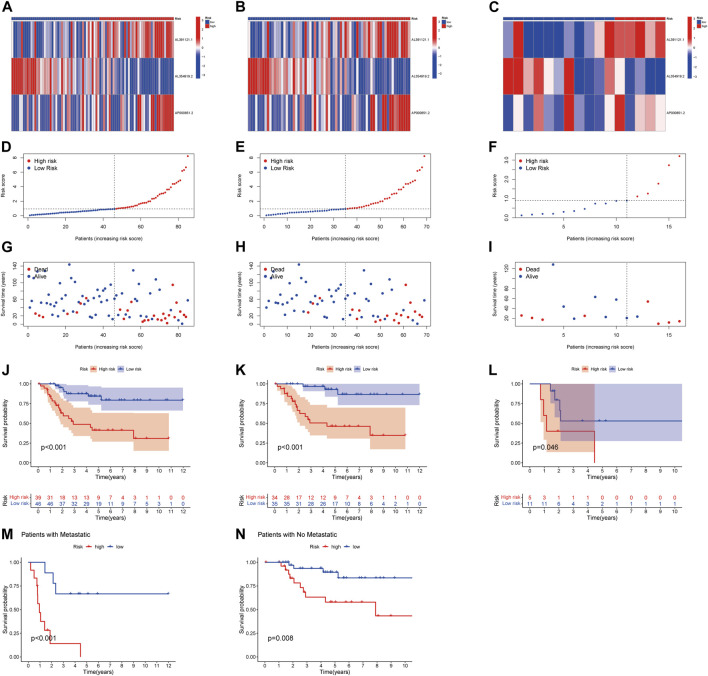
FIGURE 3.
Prognosis of the risk model in the entire, training, and testing sets. (A–C) Heatmap of the expression of three lncRNAs in the entire, training, and testing sets, respectively. (D–F) Risk model of the entire, training, and testing sets, respectively. (G–I) Survival time and survival status in the entire, training, and testing sets, respectively. (J–L) Kaplan–Meier survival curves of patients with OS in the entire, training, and testing sets, respectively. (M–N) Kaplan–Meier survival curves of patients with tumor metastasis and tumor non-metastasis.

