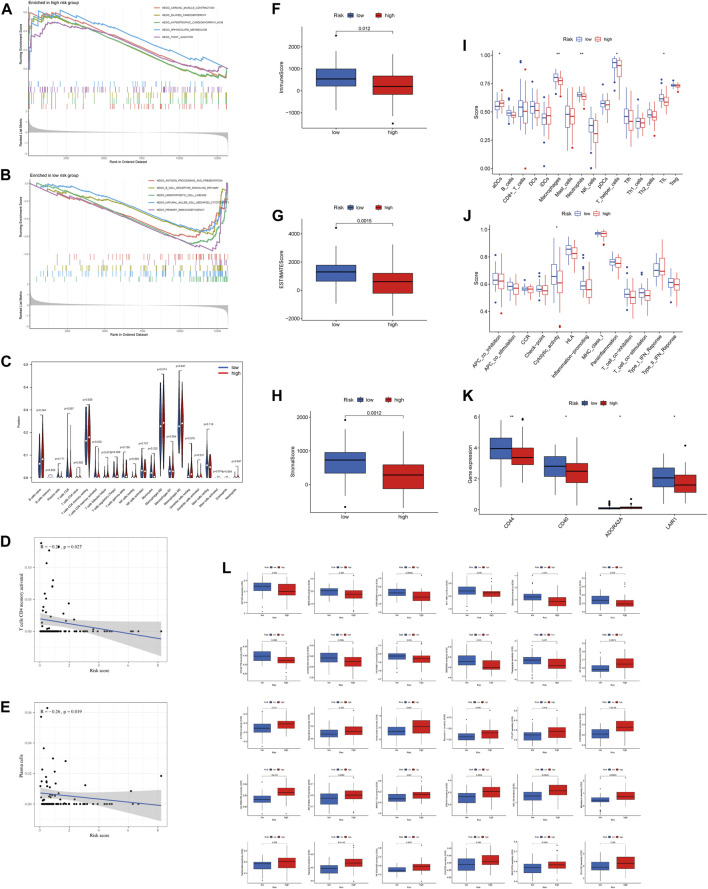
FIGURE 5.
Immune signature in the high-risk and low-risk groups. (A, B) GSEA analysis in the high-risk and low-risk groups, respectively. (C) Expression of immune cells between two groups. (D) Relationship between risk score and T cell CD4 memory activation. (E) Relationship between risk score and plasma cells. (F–H) Differential expression of TME scores (immune scores, ESTIMATE scores, and stromal scores) between risk groups. (I) Differential expression of cell infiltration between risk groups is based on the ssGSEA scores. (J) Immune functional differences between risk groups are based on the ssGSEA scores. (K) Differential expression of immune checkpoints between risk groups. (L) Sensitivity performance of 30 drugs in the high-risk and low-risk groups.

