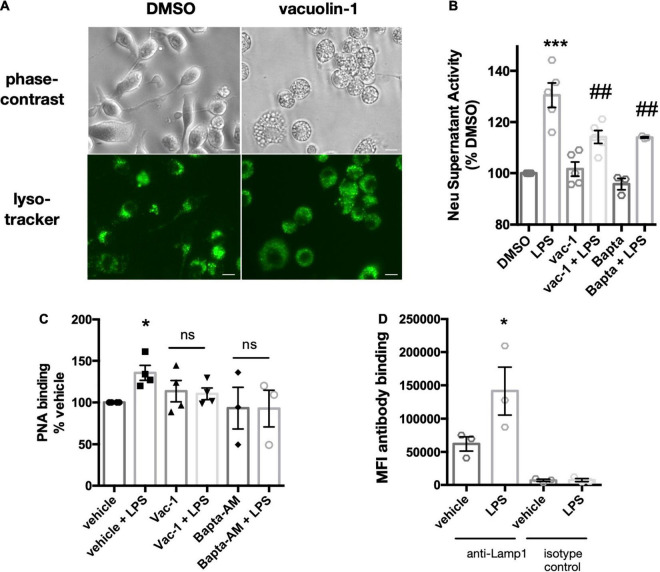
FIGURE 2.
Vacuolin-1 or BAPTA-AM block LPS-induced supernatant neuraminidase activity and surface desialylation. (A) Images of DMSO or vacuolin-1 (1 μM, 1 h) treated BV-2 microglia, stained with lysotracker-green. Images acquired with an epifluorescence microscope (20x objective) and representative of three similar experiments. Top panel, bright field. Bottom panel, FITC/488-fluorescence channel. Scale bar – 10 μm (B) Supernatant neuraminidase activity assays (pH 7.2) of vehicle or LPS-treated (1 μg/ml, 6 h) BV-2 microglia. Cells were pre-treated for 1 h with inhibitors vacuolin-1 (400 nM) or BAPTA-AM (10 μM). Data presented as mean fluorescence intensities of three independent BV-2 culture preparations (± S.E.M) normalized to DMSO control. Statistical analysis was performed on the original non-normalized data set: one-way ANOVA with Tukey’s post hoc analysis, ***p < 0.001 versus DMSO, ##p < 0.01 versus LPS. (C) Binding of the FITC-conjugated lectin peanut agglutinin (PNA) to BV-2 microglia as measured by flow cytometry. Data presented as fluorescence intensities normalized to DMSO control from n = 3 independent experiments. Statistical analysis was performed on the original non-normalized data set: one-way ANOVA with Tukey’s post hoc test, *p < 0.05, ns: non-significant. (D) Antibody binding (anti-Lamp1 or isotype control) to LPS (100 ng/ml)-stimulated or vehicle treated BV-2 microglia. Binding to live, unfixed cells was assessed by flow cytometry. Data presented as mean fluorescence intensities (MFI) of 5000 events collected from three independent BV-2 culture preparations (± S.E.M). Statistics: one-way ANOVA with Tukey’s post hoc analysis, *p < 0.05 versus anti-Lamp1 + vehicle.

