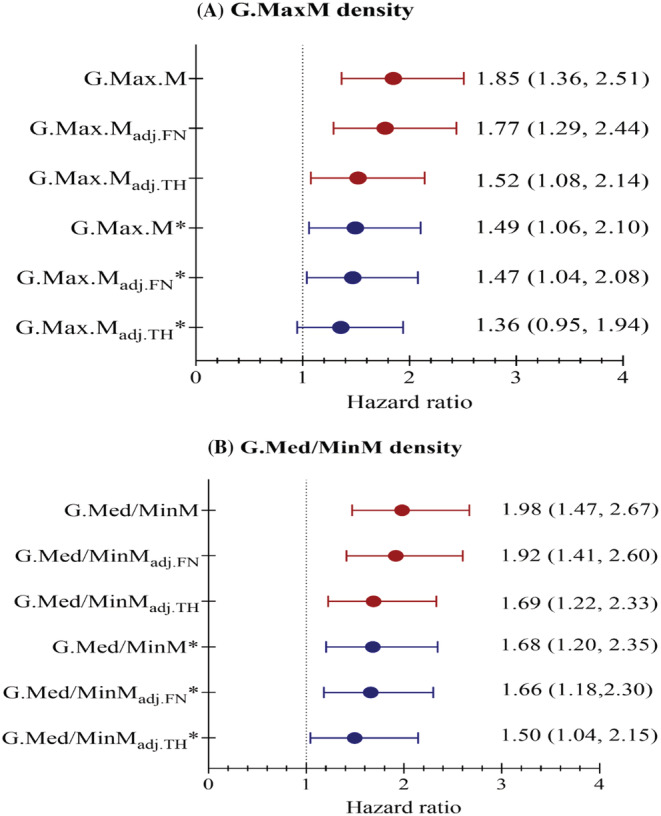
Figure 3.

Unadjusted and adjusted hazard ratios of second hip fracture per one SD increase of G.MaxM density (A) and G.Med/MinM density (B). *Adjusted for age, sex, T2DM, and Parker Mobility Score prior to first hip fracture; SD, standard deviation; adj. FN refers to adjusted for femoral neck (FN) aBMD; adj.TH refers to adjusted for total hip (TH) aBMD.
