
Figure 1.
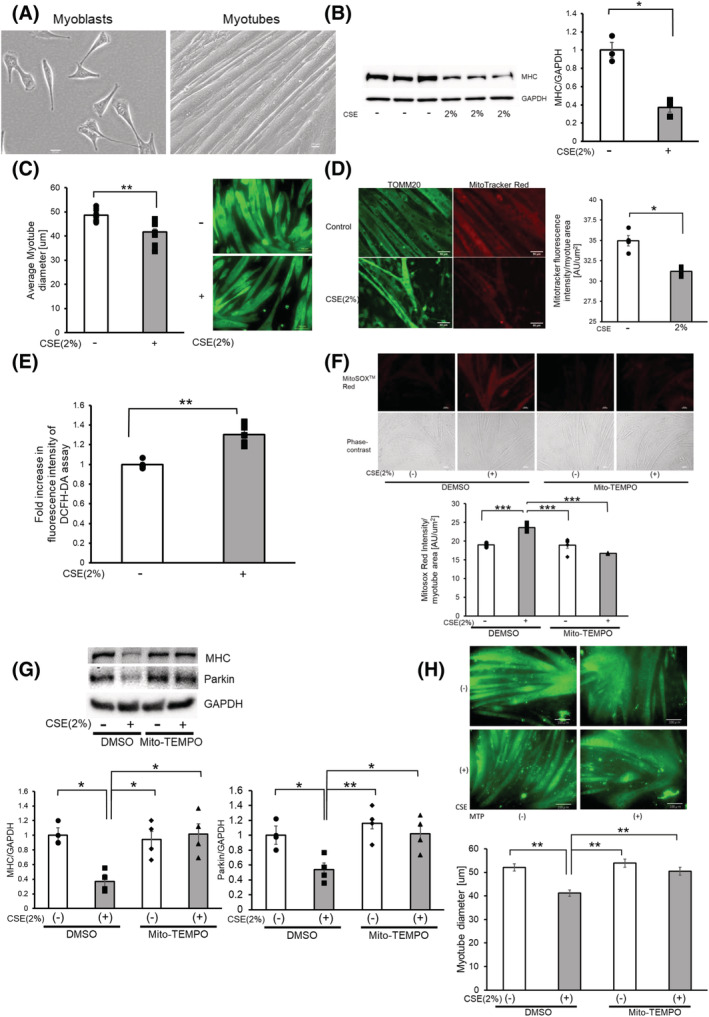
CSE induces mitochondrial damage and ROS production accompanied by myotube atrophy. (A) Phase‐contrast images of myoblasts and myotubes. Myoblasts were differentiated for 5 days to form myotubes. Bar: 20 μm. (B) Western blotting (WB) using anti‐MHC and anti‐GAPDH in control‐treated (Lanes 1 to 3) and CSE (2% for 48 h)‐treated (Lanes 4 to 6) myotubes. The right panel shows the average (±SEM) of the relative decrease in MHC normalized to GAPDH, determined from densitometric analysis of WB from three independent experiments. Open bars indicate no treatment, whereas filled bars indicate CSE treatment. *P < 0.05. (C) Images of immunofluorescent staining of MHC in 2% CSE‐treated myotubes for 48 h. Bar: 100 μm. The left panel shows the average (±SEM) of the myotube diameter. The diameter of 10 randomly selected myotubes were averaged using five images. Open bars indicate no treatment, whereas filled bars indicate CSE treatment. **P < 0.01. (D) Fluorescence microscope images of TOMM20 staining of mitochondria (left panels) and MitoTracker Red staining (right panels). Myotubes were treated with CSE (2%) for 48 h (lower panels) or control (upper panels). Bar: 50 μm. MitoTracker Red staining was quantified using BZ‐X800 analyzer and normalized by the area of the myotube (rightmost panel). (E) Fluorescence intensity of DCFH‐DA staining for intracellular ROS production of myotubes in response to CSE exposure. The fluorescence level in the control‐treated myotubes was designated as 1.0. **P < 0.01. (F) Fluorescence microscope images of MitoSOX Red staining for mitochondrial ROS production (uppermost panels), and phase‐contrast images of myotubes (middle panels). Myotubes were pretreated with Mito‐TEMPO (100 μM) for 6 h before CSE exposure (2% for 24 h). Bar: 50 μm. MitoSOX Red staining was quantified using BZ‐X800 analyzer and normalized by the area of the myotube (bottom panel). (G) WB using anti‐MHC, anti‐Parkin, and anti‐GAPDH in DMSO‐treated (Lanes 1 and 2), and Mito‐TEMPO (100 μM)‐treated myotubes (Lanes 3 and 4). Pretreatment with Mito‐TEMPO (100 μM) for 6 h before CSE exposure (2% for 48 h). The lower left panel shows the average (±SEM) of the relative expression in MHC normalized to GAPDH, which was determined from densitometric analysis of WB from four independent experiments. The lower right panel shows the average (±SEM) of the relative expression in Parkin normalized to GAPDH, which was determined from densitometric analysis of WB from four independent experiments. Open bars indicate no treatment, whereas filled bars indicate CSE treatment. *P < 0.05; **P < 0.01. (H) Images of immunofluorescent staining of MHC in myotubes treated with PBS (upper panels) and CSE (2%) for 48 h (lower panels) with the addition of DMSO (left column) and Mito‐TEMPO (right column). Bar: 100 μm. Bottom panels show the average (±SEM) of the myotube diameter. The diameter of 10 randomly selected myotubes were measured using nine images. Open bars indicate no treatment, whereas filled bars indicate CSE‐treated treatment. **P < 0.01.