
Figure 3.
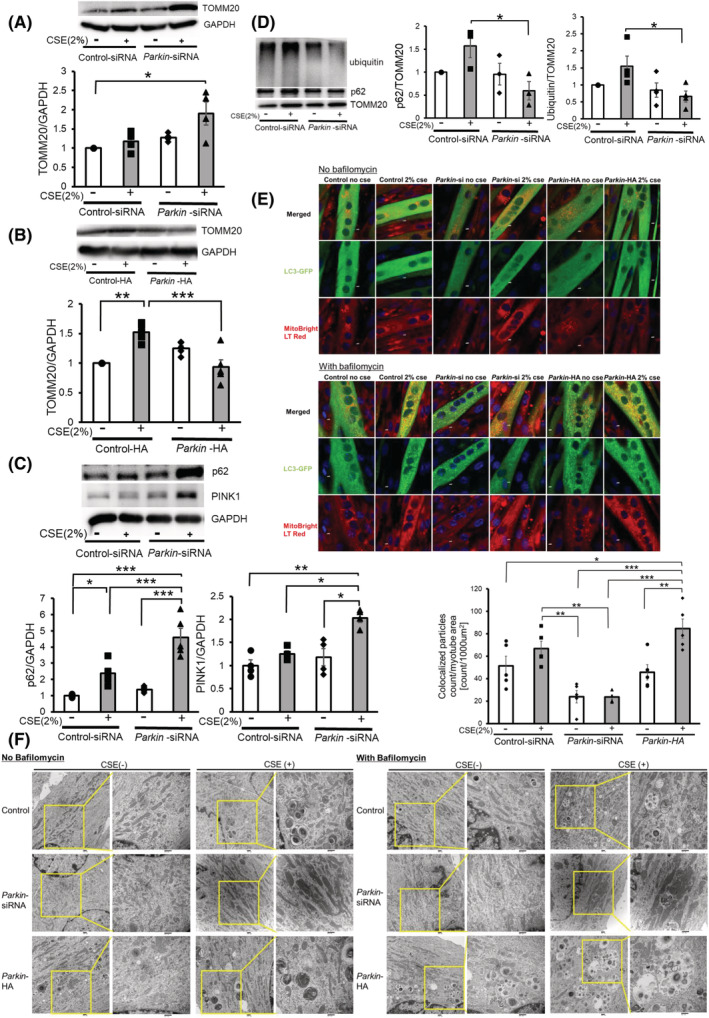
Parkin‐mediated mitophagy is involved in atrophic changes of myotubes during CSE exposure through modulating mitochondrial integrity. (A) WB using anti‐TOMM20 and anti‐GAPDH in control siRNA‐treated (Lanes 1 and 2) and Parkin siRNA‐treated (Lanes 3 and 4) myotubes with CSE exposure (2% for 48 h). The lower panel shows the average (±SEM) of the relative increase in TOMM20 normalized to GAPDH, determined from densitometric analysis of WB from four independent experiments. Open bars indicate no treatment, whereas filled bars indicate CSE treatment. *P < 0.05. (B) WB using anti‐TOMM20 and anti‐GAPDH in control vector (Lanes 1 and 2) and Parkin HA expression vector (Lanes 3 and 4). CSE treatment (2% for 48 h) was started 72 h post‐transfection. The lower panel shows the average (±SEM) of the relative expression in TOMM20 normalized to GAPDH, determined from densitometric analysis of WB from four independent experiments. Open bars indicate no treatment, whereas filled bars indicate CSE treatment. **P < 0.01; ***P < 0.001. (C) WB using anti‐p62, anti‐PINK1 and anti‐GAPDH in control siRNA‐treated (Lanes 1 and 2) and Parkin siRNA‐treated (Lanes 3 and 4) myotubes with CSE exposure (2% for 48 h). The middle and right panels show the average (±SEM) of the relative increase in p62 and PINK1 normalized to GAPDH, determined from the densitometric analysis of WB from five and four independent experiments, respectively. Open bars indicate no treatment, whereas filled bars indicate CSE treatment. *P < 0.05; **P < 0.01; ***P < 0.001. (D) WB using anti‐p62, anti‐ubiquitin, and anti‐TOMM20 in control siRNA‐treated (Lanes 1 and 2) and Parkin siRNA‐treated (Lanes 3 and 4) myotubes. CSE treatment (2.0%) was started after 5 days of differentiation, and protein samples from mitochondrial fractions were collected after 48 h of treatment. Shown is a representative experiment of 3 showing similar results. The middle panel is the average (±SEM) relative increase in p62 normalized to TOMM20, which are taken from the densitometric analysis of WB from three independent experiments. The rightmost panel is the average (±SEM) relative increase in ubiquitin normalized to TOMM20, which are taken from the densitometric analysis of WB from four independent experiments. Open bar is no treatment; filled bar is CSE treatment. *P < 0.05. (E) Colocalization analysis of confocal laser scanning microscope images of MitoBright LT Red‐stained mitochondria and ECFP‐LC3B. Myotubes were co‐transfected with pEGFP‐LC3B vector and control‐siNRA (Lanes 1 and 2), Parkin siRNA (Lanes 3 and 4), or Parkin HA expression vector (Lanes 5 and 6). Myotubes were treated with 2% CSE for 48 h in the absence or presence of bafilomycin A1 (Baf A1, 200 nM). Bar: 5 μm. The bottom panel showed the quantitative measurement of colocalized particles standardized by the myotube area. (F) Electron microscope images of mitochondria and autophagosomes in myotubes. Myotubes were transfected with control‐siNRA (upper lane), Parkin siRNA (middle lane), or Parkin HA expression vector (lower lane). Myotubes were treated with 2% CSE for 48 h in the absence or presence of Baf A1. Bar: 500 nm.