
Figure 4.
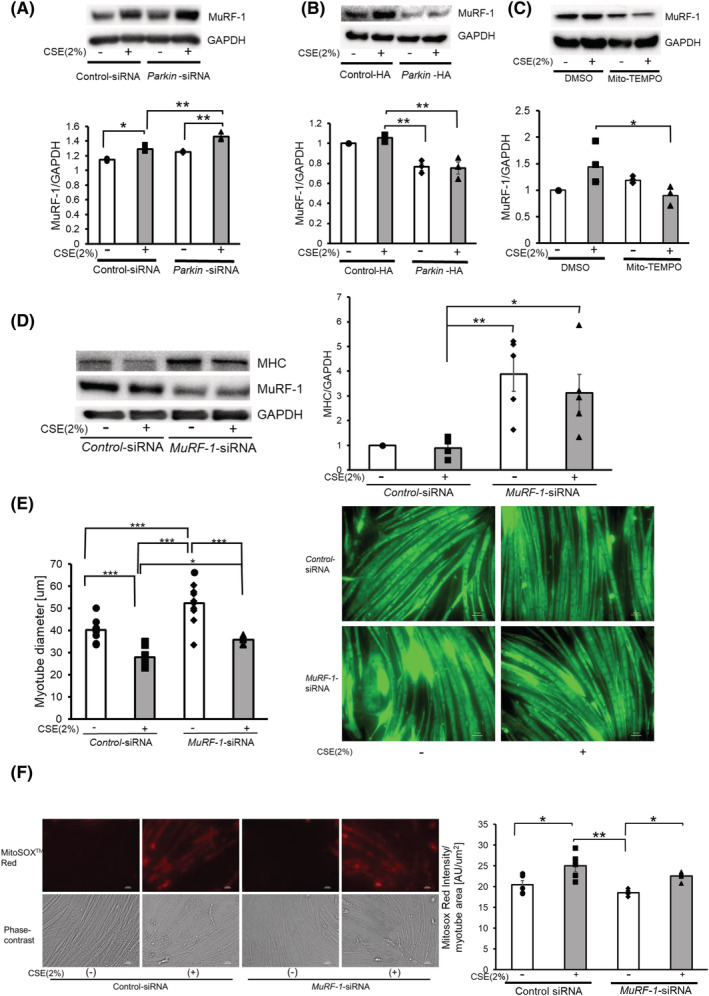
MuRF‐1 is responsible for atrophic changes in myotubes in the presence of insufficient Parkin‐mediated mitophagy. (A) WB using anti‐MuRF‐1 and anti‐GAPDH in control siRNA‐treated (Lanes 1 and 2) and Parkin siRNA‐treated (Lanes 3 and 4) myotubes with CSE exposure (2% for 48 h). The lower panel shows the average (±SEM) of the relative increase in MuRF‐1 normalized to GAPDH, determined from densitometric analysis of WB from three independent experiments. Open bars indicate no treatment, whereas filled bars indicate CSE treatment. *P < 0.05; **P < 0.01. (B) WB using anti‐MuRF‐1 and anti‐GAPDH in control vector‐treated (Lanes 1 and 2) and Parkin HA expression vector‐treated (Lanes 3 and 4) myotubes with CSE exposure (2% for 48 h). The lower panel shows the average (±SEM) of the relative increase in MuRF‐1 normalized to GAPDH, determined from densitometric analysis of WB from three independent experiments. Open bars indicate no treatment, whereas filled bars indicate CSE treatment. **P < 0.01. (C) WB using anti‐MuRF‐1 and anti‐GAPDH in DMSO‐treated (Lanes 1 and 2) and Mito‐TEMPO‐treated (Lanes 3 and 4) myotubes with CSE exposure (2% for 48 h). The lower panel shows the average (±SEM) of the relative increase in MuRF‐1 normalized to GAPDH, determined from densitometric analysis of WB from three independent experiments. Open bars indicate no treatment, whereas filled bars indicate CSE treatment. *P < 0.05. (D) WB using anti‐MHC, anti‐MuRF‐1 and anti‐GAPDH in control siRNA‐treated (Lanes 1 and 2) and MuRF‐1 siRNA‐treated (Lanes 3 and 4) myotubes with CSE exposure (2% for 48 h). The right panel shows the average (±SEM) of the relative increase in MHC normalized to GAPDH, determined from densitometric analysis of WB from five independent experiments. Open bars indicate no treatment, whereas filled bars indicate CSE treatment. *P < 0.05; **P < 0.01. (E) Images of immunofluorescent staining of MHC in control or CSE (2%)‐treated myotubes. Bar: 50 μm. Myotubes were transfected with nonsilencing control siRNA and MuRF‐1 siRNA, and CSE treatment (2% for 48 h) was started after 72 h post‐transfection. The left panel shows the average (±SEM) of the myotube diameter. The diameters of 10 randomly selected myotubes were averaged using nine images per group. Open bars indicate no treatment, whereas filled bars indicate CSE treatment. *P < 0.05; ***P < 0.001. (F) Fluorescence microscope detection of MitoSOX Red staining for mitochondrial ROS production (upper panels) and phase‐contrast images of myotubes (lower panels) in control or CSE (2%)‐treated myotubes. Myotubes were transfected with nonsilencing control siRNA and MuRF‐1 siRNA, and CSE treatment (2% for 24 h) was started after 72 h post‐transfection. Bar: 50 μm. MitoSOX Red staining was quantified using BZ‐X800 analyzer and normalized by the stained myotube area (rightmost panel).