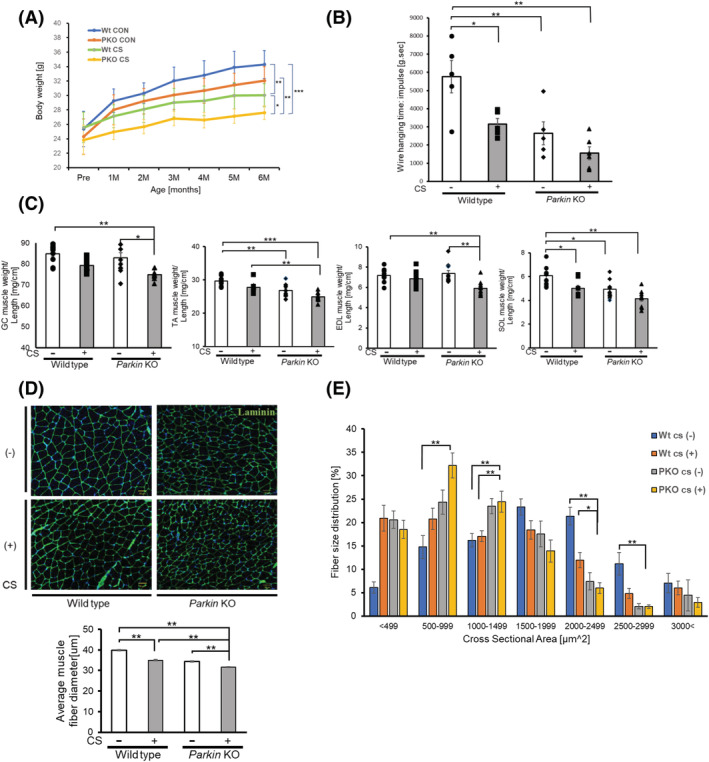
Figure 5.

Effects of long‐term cigarette smoke (CS) exposure on Parkin knockout mice. (A) Time course of body weight during 6‐month CS exposure for wild‐type (WT) and Parkin knockout (PKO) mice (n = 7 to 9). Data are presented as mean ± SEM. *P < 0.05; **P < 0.01. ***P < 0.001. (B) Panel showing wire hanging time (impulse score) in linear wire hanging test. Mice were allowed to grasp the middle of the wire with their fore limbs, and the time until the mice completely released their grasp and fell down was recorded. Mice were provided three trials, and data were recorded as the maximum holding impulse, which is the hanging time in seconds multiplied by animal weight in grams. Data are presented as mean ± SEM, (n = 5 to 6). *P < 0.05. **P < 0.01. (C) Panel showing the weights of Musculus (M) gastrocnemius (GC), M. tibialis anterior (TA), M. soleus (SOL), and M. extensor digitorum longus (EDL) muscles of WT and PKO mice. All hindlimb muscle weights were normalized to the tibia length (n = 7 to 9). Data are presented as mean ± SEM. *P < 0.05, **P < 0.01, ***P < 0.001. (D) Representative images of laminin‐stained GC muscle sections of WT and PKO mice. Bar: 50 μm. The lower panel shows the average (±SEM) of the muscle fibre diameter. Open bars indicate no treatment, whereas filled bars indicate CSE treatment. **P < 0.01. (E) the panel showing the distribution of myofibre cross‐sectional area (CSA) in GC muscles of WT and PKO mice. Data are presented as mean ± SEM. *P < 0.05; **P < 0.01.
