
Figure 8.
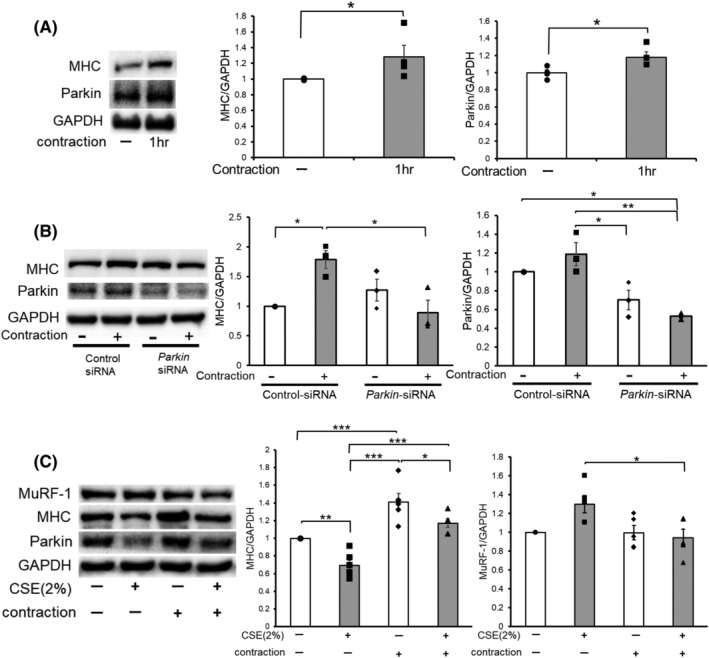
Contraction of the muscle enhanced Parkin expression levels, causing muscle hypertrophy and protection from CSE‐induced atrophy. (A) WB using anti‐MHC, anti‐Parkin, and anti‐GAPDH in no contraction (Lane 1) and 1 h contraction‐treated (Lane 2) myotubes. Myotubes were stimulated with 10 V electric pulses for 20 ms at 1 Hz interval. Right panels show the average (±SEM) of the relative increase in MHC or Parkin normalized to GAPDH, determined from densitometric analysis of WB from three independent experiments. Open bars indicate no treatment, whereas filled bars indicate 1 h contraction treatment. *P < 0.05. (B) WB using anti‐MHC, anti‐Parkin, and anti‐GAPDH in no contraction (Lanes 1 and 3) and 1 h contraction‐treated (Lanes 2 and 4) myotubes. Myotubes were transfected with nonsilencing control siRNA and Parkin siRNA, and 1 h‐electric pulse stimulations (10 V pulses for 20 ms at 1 Hz interval) were started 48 h post‐transfection. The right panels show the average (±SEM) of the relative increase in MHC or Parkin normalized to GAPDH, determined from densitometric analysis of WB from three independent experiments. Open bars indicate no treatment, whereas filled bars indicate 1 h contraction treatment. *P < 0.05; **P < 0.01. (C) WB using anti‐MHC, anti‐Parkin, and anti‐GAPDH in control or CSE (2%)‐treated myotubes. Myotubes were stimulated for 1 h with 10 V electric pulses for 20 ms at 1 Hz interval, and CSE treatment (2% for 24 h) was started 1 day after the contraction. The right panels show the average (±SEM) of the relative increase in MHC or MuRF‐1 normalized to GAPDH, determined from densitometric analysis of WB from four independent experiments. Open bars indicate no treatment, whereas filled bars indicate CSE (2%) treatment. *P < 0.05, **P < 0.01, ***P < 0.001.