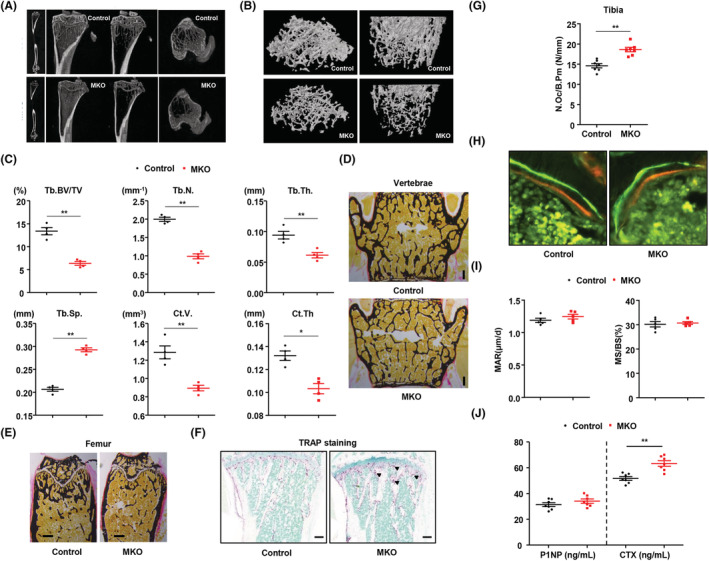
Figure 2.

Mitochondrial stress response in skeletal muscle promotes lower bone mass compared with wild‐type control. (A,B) Representative images of micro‐CT of cortical and trabecular regions in the distal femur from control and MKO mice at 14 weeks of age. (C) Measurement of Tb.Th., trabecular number (Tb.N.), BV/TV, BS/TV, BS/BV, cortical volume (Ct.V.), Tb.Sp., and total bone volume (TBV) using micro‐CT analysis. (D,E) Von Kossa staining of undecalcified sections of vertebrae and femurs of control and MKO mice at 14 weeks of age. Scale bars, 250 μm. (F) TRAP staining to reveal osteoclasts. Scale bars: 100 μm. (G) The number of osteoclasts per bone perimeter [N.Oc/B.Pm (N/mm)] is indicated. (H) Histomorphometric analysis of calcein/alizarin red double‐stained sections was conducted to quantify bone formation in vertebrae; n = 5 per group. Green indicates calcein, and red indicates alizarin red. (I) Measurement of endocortical MAR and MS/BS (%) of vertebrae in control and MKO mice. (J) Serum levels of P1NP and CTX in 14‐week‐old control and MKO mice; n = 7. Data are expressed as the mean ± standard error of the mean. Statistical significance was analysed by unpaired t‐tests. *, P < 0.05 and **, P < 0.01 compared with the indicated group.
