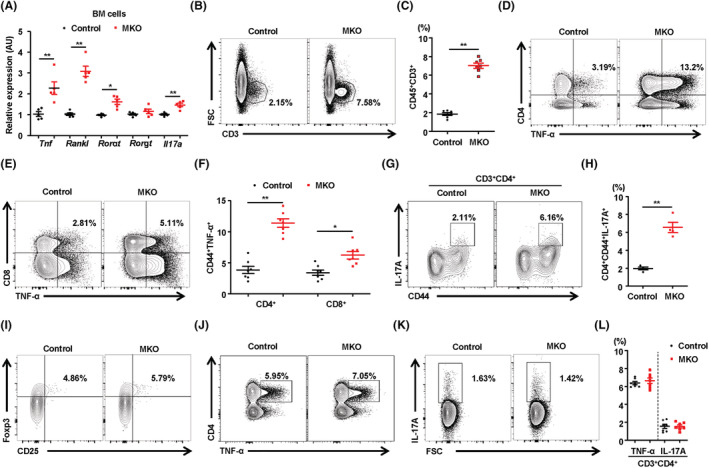
Figure 3.

MKO mice exhibit local induction of TNF‐α and IL‐17 in BM without a systemic inflammatory response. (A) BM cells isolated from control and MKO mice at 14 weeks of age were subjected to real‐time PCR analysis of osteoclastogenic genes; n = 5. (B) Representative flow cytometry contour plots are presented for CD3 expression by BM cells in control and MKO mice at 14 weeks of age; n = 7. (C) Statistical analysis of the population of CD3+ T‐cells in BM cells in the two groups. (D–H) The number of TNF‐α‐secreting or IL‐17A‐secreting cells in the populations of BM CD4+CD44+ and CD8+C44+ T‐cells was compared between the two groups; n = 7. (I) Population of regulatory T‐cells (CD4+CD25+FOXP3+) in the BM of 14‐week‐old control and MKO mice; n = 7. (J–L) TNF‐α‐producing or IL‐17A‐producing cells among CD4+ and CD8+ T‐cells from the spleens of control and MKO mice at 14 weeks of age; n = 7. Data are expressed as the mean ± standard error of the mean. Statistical significance was analysed by unpaired t‐tests. *, P < 0.05 and **, P < 0.01 compared with the indicated group.
