Figure 2.

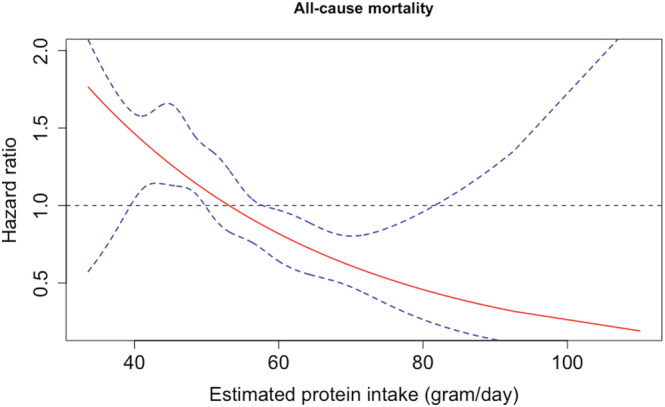
Adjusted effect of estimated protein intake on all‐cause mortality. Solid line shows the estimated linear relation, while the dotted lines represent the 95% confidence intervals using restricted cubic splines.

Adjusted effect of estimated protein intake on all‐cause mortality. Solid line shows the estimated linear relation, while the dotted lines represent the 95% confidence intervals using restricted cubic splines.