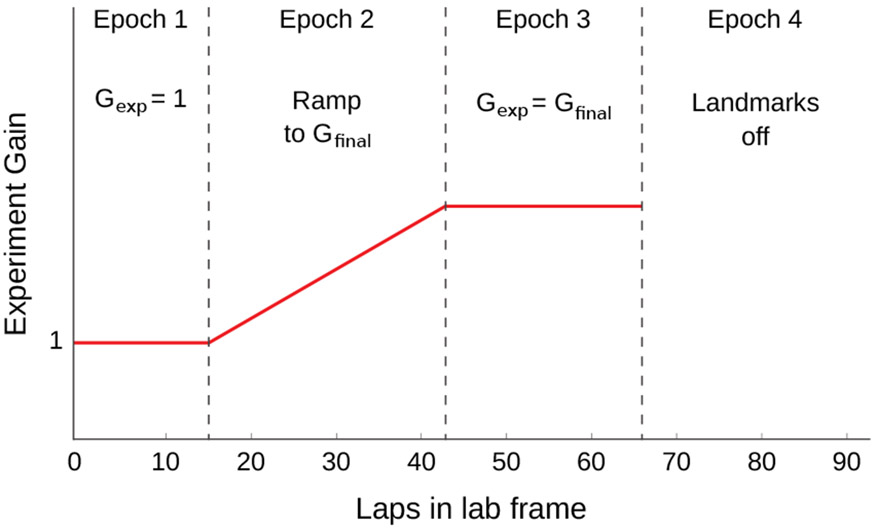
Figure 4:
Illustration of the profile of the gain, Gexp, during a typical recalibration experiment [10]. During Epoch 1, the gain was initiated at Gexp = 1, corresponding to stationary landmarks. In Epoch 2, the landmarks began to move according to an ever increasing or decreasing gain. During Epoch 3 a final experimental gain, Gexp = Gfinal, was maintained. Finally, the landmarks were extinguished during Epoch 4. The number of laps for each Epoch is illustrative and varied across actual experiments.

