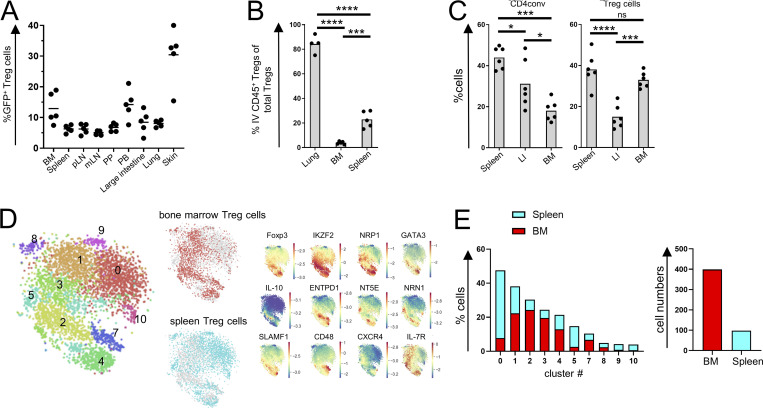
Figure 1.
Features of CXCR4+ BM Treg cells. (A) Distribution of CXCR4+ Treg cells in different tissues. mLN, mesenteric lymph nodes; PB, peripheral blood; pLN, peripheral lymph nodes; PP, Peyer’s patches. (B) Analysis of intra- (IV) and extravascular Treg cells in Foxp3DTR-EGFP mice labeled with CD45-BV570 for 3 min in the indicated tissues. (C) Analysis of CD4conv and Treg cells in CD45.1+ and CD45.2+ Foxp3DTR-EGFP parabionts 2 wk after surgery. LI, large intestine. (D) t-Distributed stochastic neighbor embedding (t-SNE) visualization of scRNA-seq of spleen and BM Treg cells. Clustering analysis (left) and select gene distribution (right). (E) Distribution of BM and spleen Treg cells among scRNA-seq clusters (left) and CXCR4+ Treg numbers (right). The data from one representative experiment of two independent experiments are shown in A–C. *, P < 0.05; ***, P < 0.001; ****, P < 0.001; ANOVA with multiple comparisons (Tukey post-hoc test; B, C).

