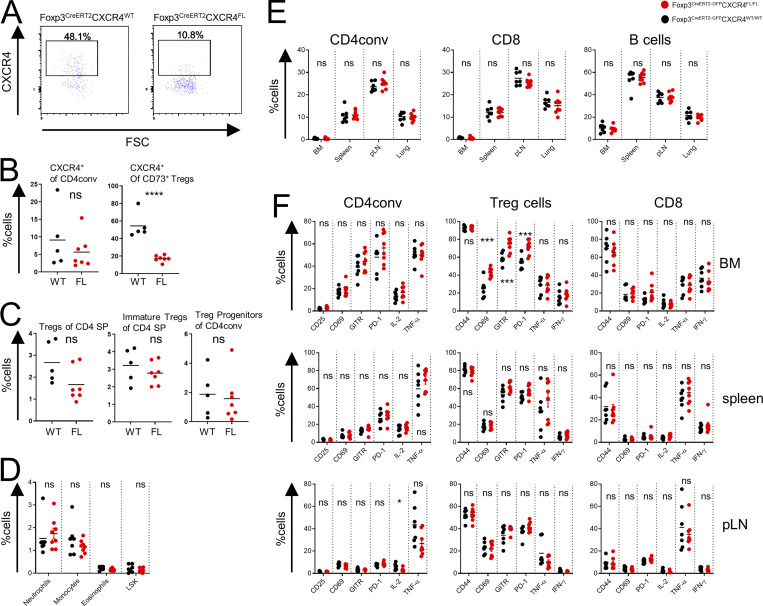
Figure S2.
Thymic Treg cells and activation markers in FL mice. (A–C) Flow cytometric analysis of thymocytes in tamoxifen-treated WT and FL mice. CXCR4 expression by thymic Treg cells (A); proportion of CXCR4+ thymic Treg cells and CD4conv cells (B); frequencies of mature (Dump−CD4+TCRβ+CD8−CD73−CD25+Foxp3+) and immature (Dump−CD4+TCRβ+CD8−CD25+Foxp3−) Treg cells and Treg progenitors (Dump−CD4+TCRβ+CD8−GITR+CD122+CD25−Foxp3−) (C). The dump gate includes staining for NK1.1, CD11b, CD19, MHC-II, TCRγδ, and CD1d tetramer. (D–F) Flow cytometric analysis of splenocytes (D); proportion of CD4conv, CD8, and B cells subsets in indicated tissues (E); and expression of activation markers and cytokine production by CD4conv, Treg cells, and CD8 cells in different tissues (F) in tamoxifen-treated FL and WT mice. Two right columns in each panel show intracellular cytokine production after in vitro stimulation. The data are shown for one representative of two (A–C) or three (D–F) independent experiments. pLN, peripheral lymph nodes; SP, single positive. *, P < 0.05; ***, P < 0.001; ****, P < 0.0001; unpaired Student’s t test.

