Fig. 1.
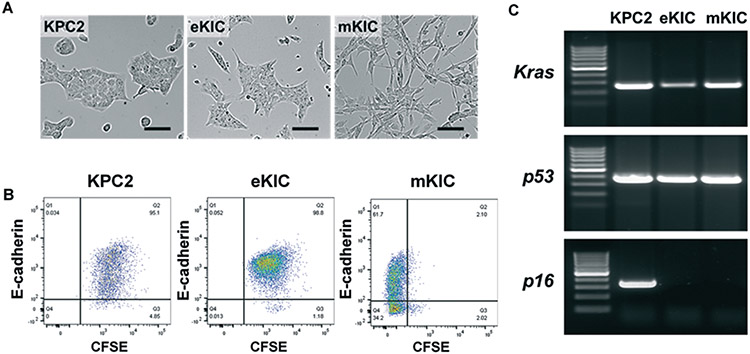
Characteristics of KPC2, eKIC, and mKIC in 2D monolayer. (A) Bright-field micrograph of 2D monolayer of KPC2, eKIC, and mKIC. (B) Fluorescence-activated cell sorting (FACS) for E-cadherin (E-cad) and CFSE expressed in the cells. KPC2 and eKIC were stained by CFSE to distinguish from mKIC in co-cultures. A majority of the KPC2 and eKIC cells expressed E-cad whereas mKIC cells had a large negative population. (C) qPCR for Kras, p53, and p16 mutations. Scale bars indicate 100 μm.

