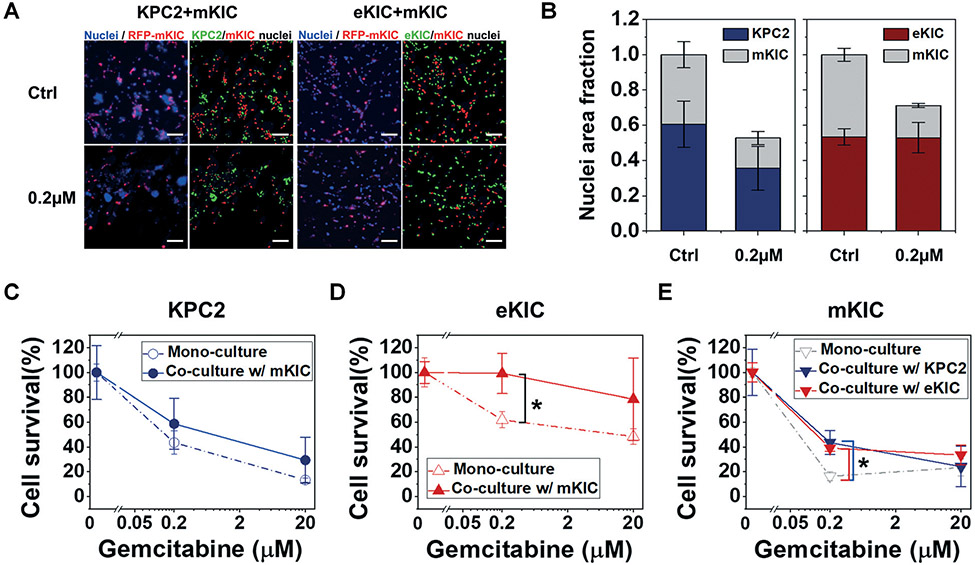
Fig. 4.
Response of KPC2 and eKIC co-cultured with mKIC to gemcitabine. Initial co-culture ratio in both KPC2–mKIC and eKIC–mKIC models were 1 : 1. (A) Fluorescent micrograph of co-cultured KPC2–mKIC and eKIC–mKIC of control (Ctrl), 0.2 μM, and 20 μM gemcitabine treatment groups. In (A), nuclei (blue) of each cell are distinguished in green (KPC2 and eKIC) and red (mKIC). (B) Nuclei area fraction of each cell line was defined over the total nuclear area of ctrl, representing the cell growth in co-culture condition in control (Ctrl) and 0.2 μM gemcitabine treatment groups. Cell survival of each cell line in 0.2 μM and 20 μM gemcitabine treatment groups of (C) KPC2, (D) eKIC, and (E) mKIC in mono-culture (dash line) and co-culture (solid line) were presented. In results, eKIC was significantly resistant to the 0.2 μM gemcitabine. To determine each cell line, RFP-mKIC was used. The co-cultured PCCs were studied in iT-MOC; n = 3. Bar: mean ± S.E.M. Statistical analysis was done for comparisons of co-culture and mono-culture of 0.2 μM and 20 μM gemcitabine treatment groups. *: p < 0.05 (Student's t-test). Scale bar indicates 100 μm.

