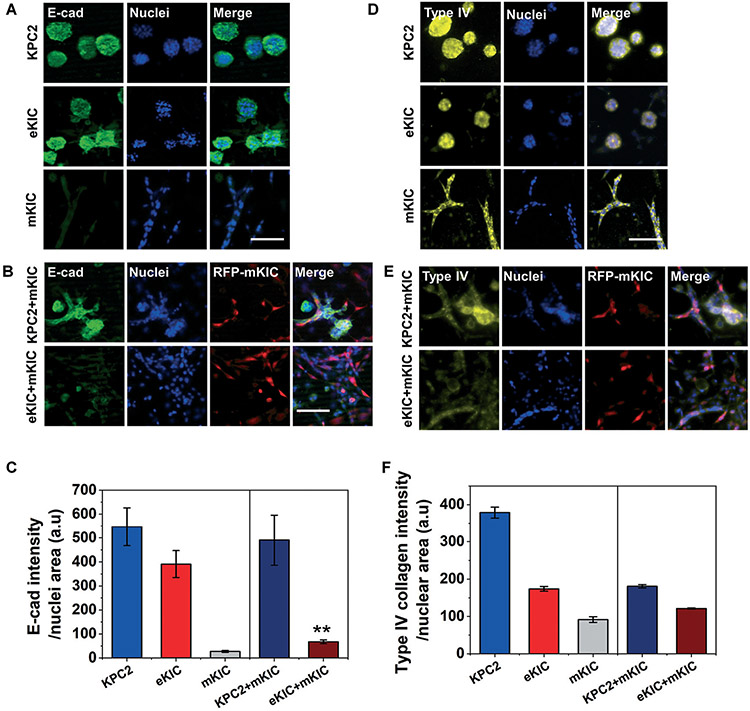
Fig. 5.
Immunostaining micrographs of (A–C) E-cad (green) and (D–F) type IV collagen (yellow) in iT-MOC models. Immunofluorescent levels of E-cad in (A) mono-cultured KPC2, eKIC, and mKIC and (B) co-cultured KPC2 and eKIC with the RFP-mKIC (red) in iT-MOC were quantified in (C) E-cad intensity per nuclear area. E-cad expression of eKIC decreased significantly by interacting mKIC. Type IV collagen expression in (D) mono-cultured KPC2, eKIC, and mKIC and (E) co-cultured KPC2 and eKIC with the RFP-mKIC (red) was quanfied in (F). Type IV collagen expressed in all cells. A slight decrease of type IV collagen was noted in the KPC2–mKIC co-culture group. n ≥ 3; bar: mean ± S.E.M. Statistical analysis was done for comparisons of co-culture and mono-culture by assuming the E-cad level of mKIC is negligible in co-culture. **: p < 0.01 (Student's t-test). Scale bar indicates 100 μm.

