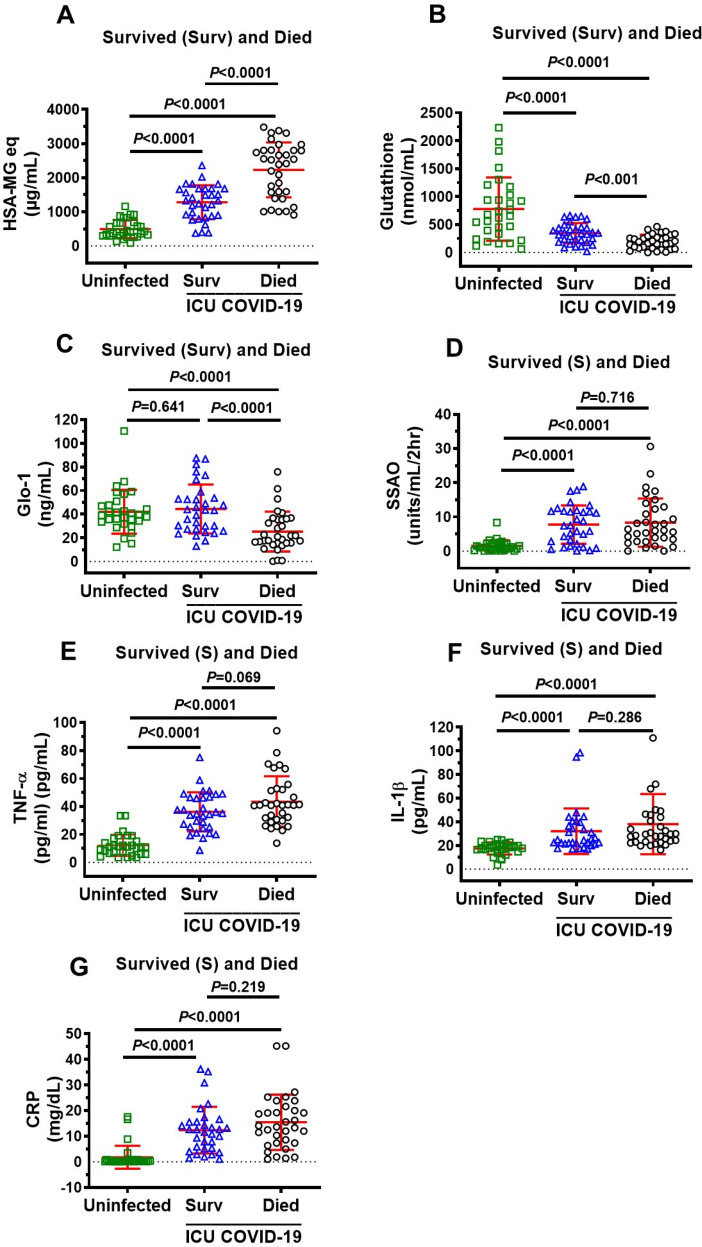
Figure 2.
Plasma levels of MG, glutathione, Glo1, SSAO activity, TNF-α, IL-1β and CRP in uninfected controls and ICU COVID-19 patients that survived and died. (A) MG levels in plasma from ICU COVID-19 patients that survived and died were significantly higher than that in uninfected controls. MG levels in plasma from ICU COVID-19 that died were also significantly higher than ICU COVID-19 patients that survived. (B) Glutathione in plasma from ICU COVID-19 patients that survived and died were significantly lower than that in uninfected controls. Glutathione levels in plasma from ICU COVID-19 that died were also significantly lower than ICU COVID-19 patients that survived. (C) Glo1 in plasma from ICU COVID-19 patients that survived were not significantly different from that in uninfected controls. Glo1 levels in plasma from ICU COVID-19 patients that died were significantly lower than that in uninfected controls and ICU COVID-19 patients that survived. (D) SSAO activities in plasma from ICU COVID-19 patients that survived and died were significantly higher than that in uninfected controls. However, there were no significant difference in plasma SSAO activities between ICU COVID-19 patients that survived and died. (E) TNF-α levels in plasma from ICU COVID-19 patients that survived and died were significantly higher than that in uninfected controls. However, there were no significant difference in plasma levels of TNF-α in ICU COVID-19 patients that survived and died. (F) IL-1β levels in plasma from ICU COVID-19 patients that survived and died were significantly higher than that in uninfected controls. However, there were no significant difference in plasma levels of IL-1β in ICU patients that survived and died. (G) CRP levels in plasma from ICU COVID-19 patients that survived and died were significantly higher than that in uninfected controls. However, there were no significant difference in plasma levels of CRP in ICU patients that survived and died. Data shown are mean ± S.E.M from n = 30 in uninfected controls (26.6% females), n = 33 died (42.4% females) and n = 32 in survived (37.5% females). Statistical significance levels are shown above data points on each graph.

