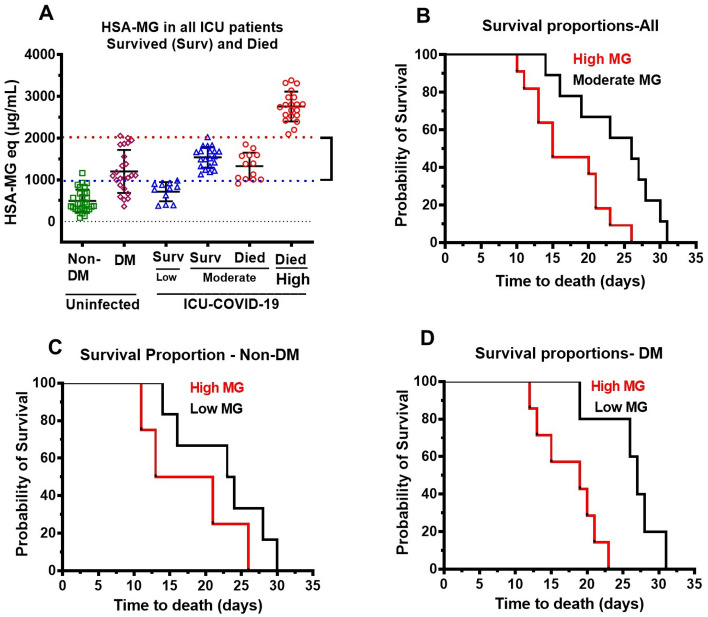
Figure 9.
Kaplan–Meier curves for non-DM and DM ICU COVID-19 patients that died. (A) Low MG (< 2 times higher than uninfected non-DM), moderate MG (between 2 and 3 times higher than uninfected non-DM) and high MG (> 4times higher than uninfected non-DM) in ICU patients that survived and died along with MG in uninfected non-DM and DM individuals. Data shown are mean ± S.E.M for each of n = 30 uninfected controls (26.6% females), n = 11 survived for low, and n = 21 survived moderate. n = 13 died for moderate and n = 20 died, for high MG. (B) Kaplan–Meier survival curve for all ICU COVID-19 patients that died with moderate MG (n = 13) and high MG (n = 20). (C) Kaplan–Meier survival curve for non-DM ICU COVID-19 patients that died with moderate (n = 8) and high MG (n = 8). (D) Kaplan–Meier survival curve for DM ICU COVID-19 patients that died with moderate (n = 5) and high MG (n = 12).

