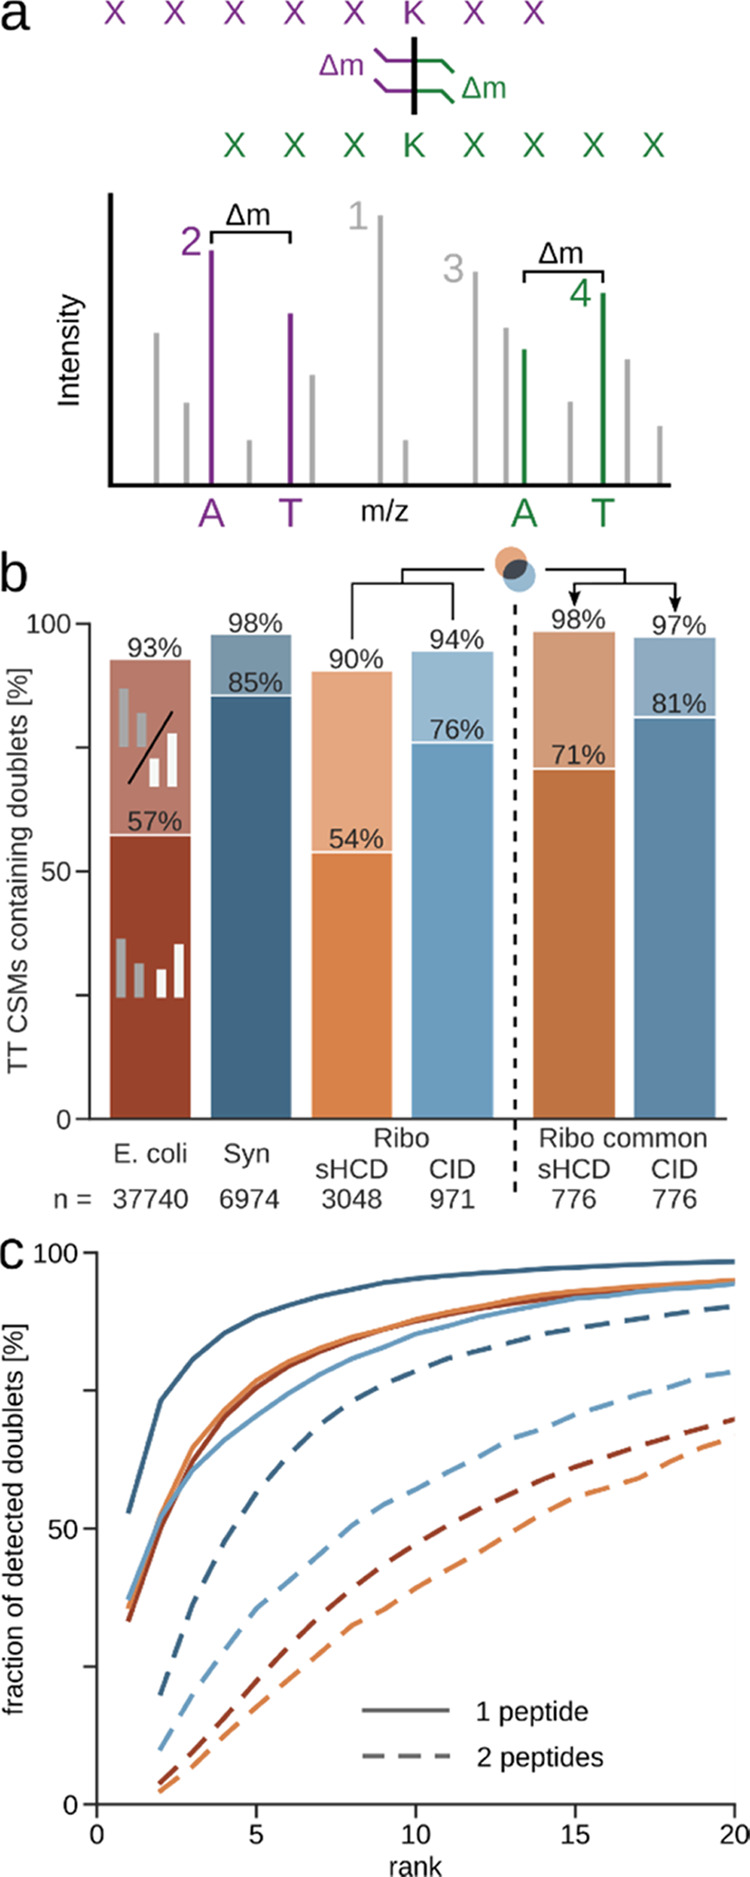
Figure 1.

Statistics on frequency and intensity of peptide doublet peaks. (a) Illustration of DSSO cleavage and the resulting signature peptide doublets with the distinct mass difference Δm. Numbers annotate the intensity rank of the peaks, with the rank of the more intense of the doublet peaks being the rank of the whole doublet. (b) Ratio of identified target–target (TT) crosslink spectrum matches (CSMs) (self and heteromeric) that contain one (lighter color) or both (darker color) peptide doublets in each dataset (5% CSM-level FDR). Datasets using stepped HCD (sHCD) are shown in orange-red, while collision-induced dissociation (CID)-MS3-based methods are in blue. (c) Fraction of detected doublets from (b) passing each intensity rank cutoff. Shown is the cumulative proportion of CSMs containing doublets. Datasets are colored as in (b). Synapse (Syn); Ribosome (Ribo).
