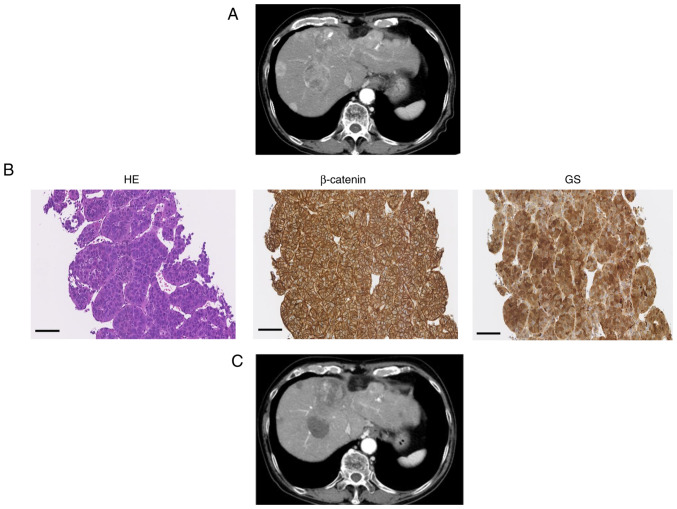
Figure 2.
Typical case 1 (WNT/β-catenin signal activation). (A) CT image of early arterial phase before treatment. (B) HE staining of liver sections (magnification, ×200; black scale bar, 100 µm). β-catenin and GS staining of liver tissue was performed to evaluate WNT/β-catenin signal activation (magnification, ×200; black scale bar, 100 µm). (C) CT image of the early arterial phase for assessment of treatment efficacy. CT, computed tomography; GS, glutamine synthetase.

