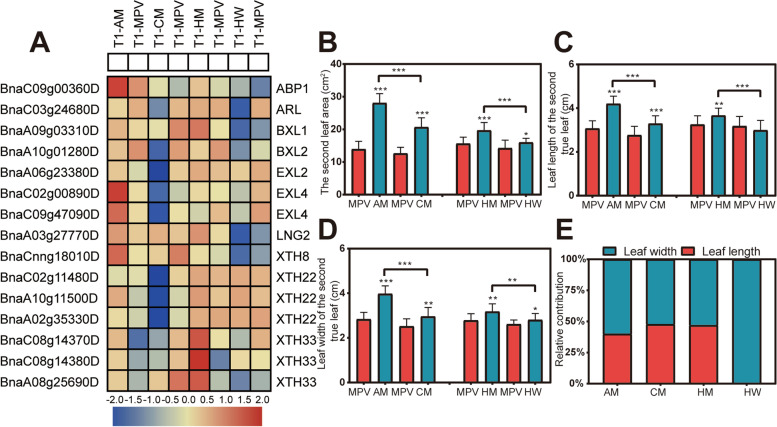
Fig. 6.
Related phenotypic changes in the second true leaf of hybrids and their parents at 21DAS. A Heat map of genes that promoted cell size in F1 hybrids relative to their parents at 21 DAS. The second true leaf area B, leaf length C, and leaf width D of all the F1 hybrids and their MPV at 21 DAS. E Histogram showing the percentage of contribution of leaf length and leaf breadth to the second true leaf area in four hybrids at 21 DAS. The data are expressed as mean ± SD, derived from the results of three biological replicates. AM, CM, HM, and HW are F1 hybrids; MPV, mid-parent value; T1: 21 DAS; *P < 0.05; **P < 0.01; ***P < 0.001

