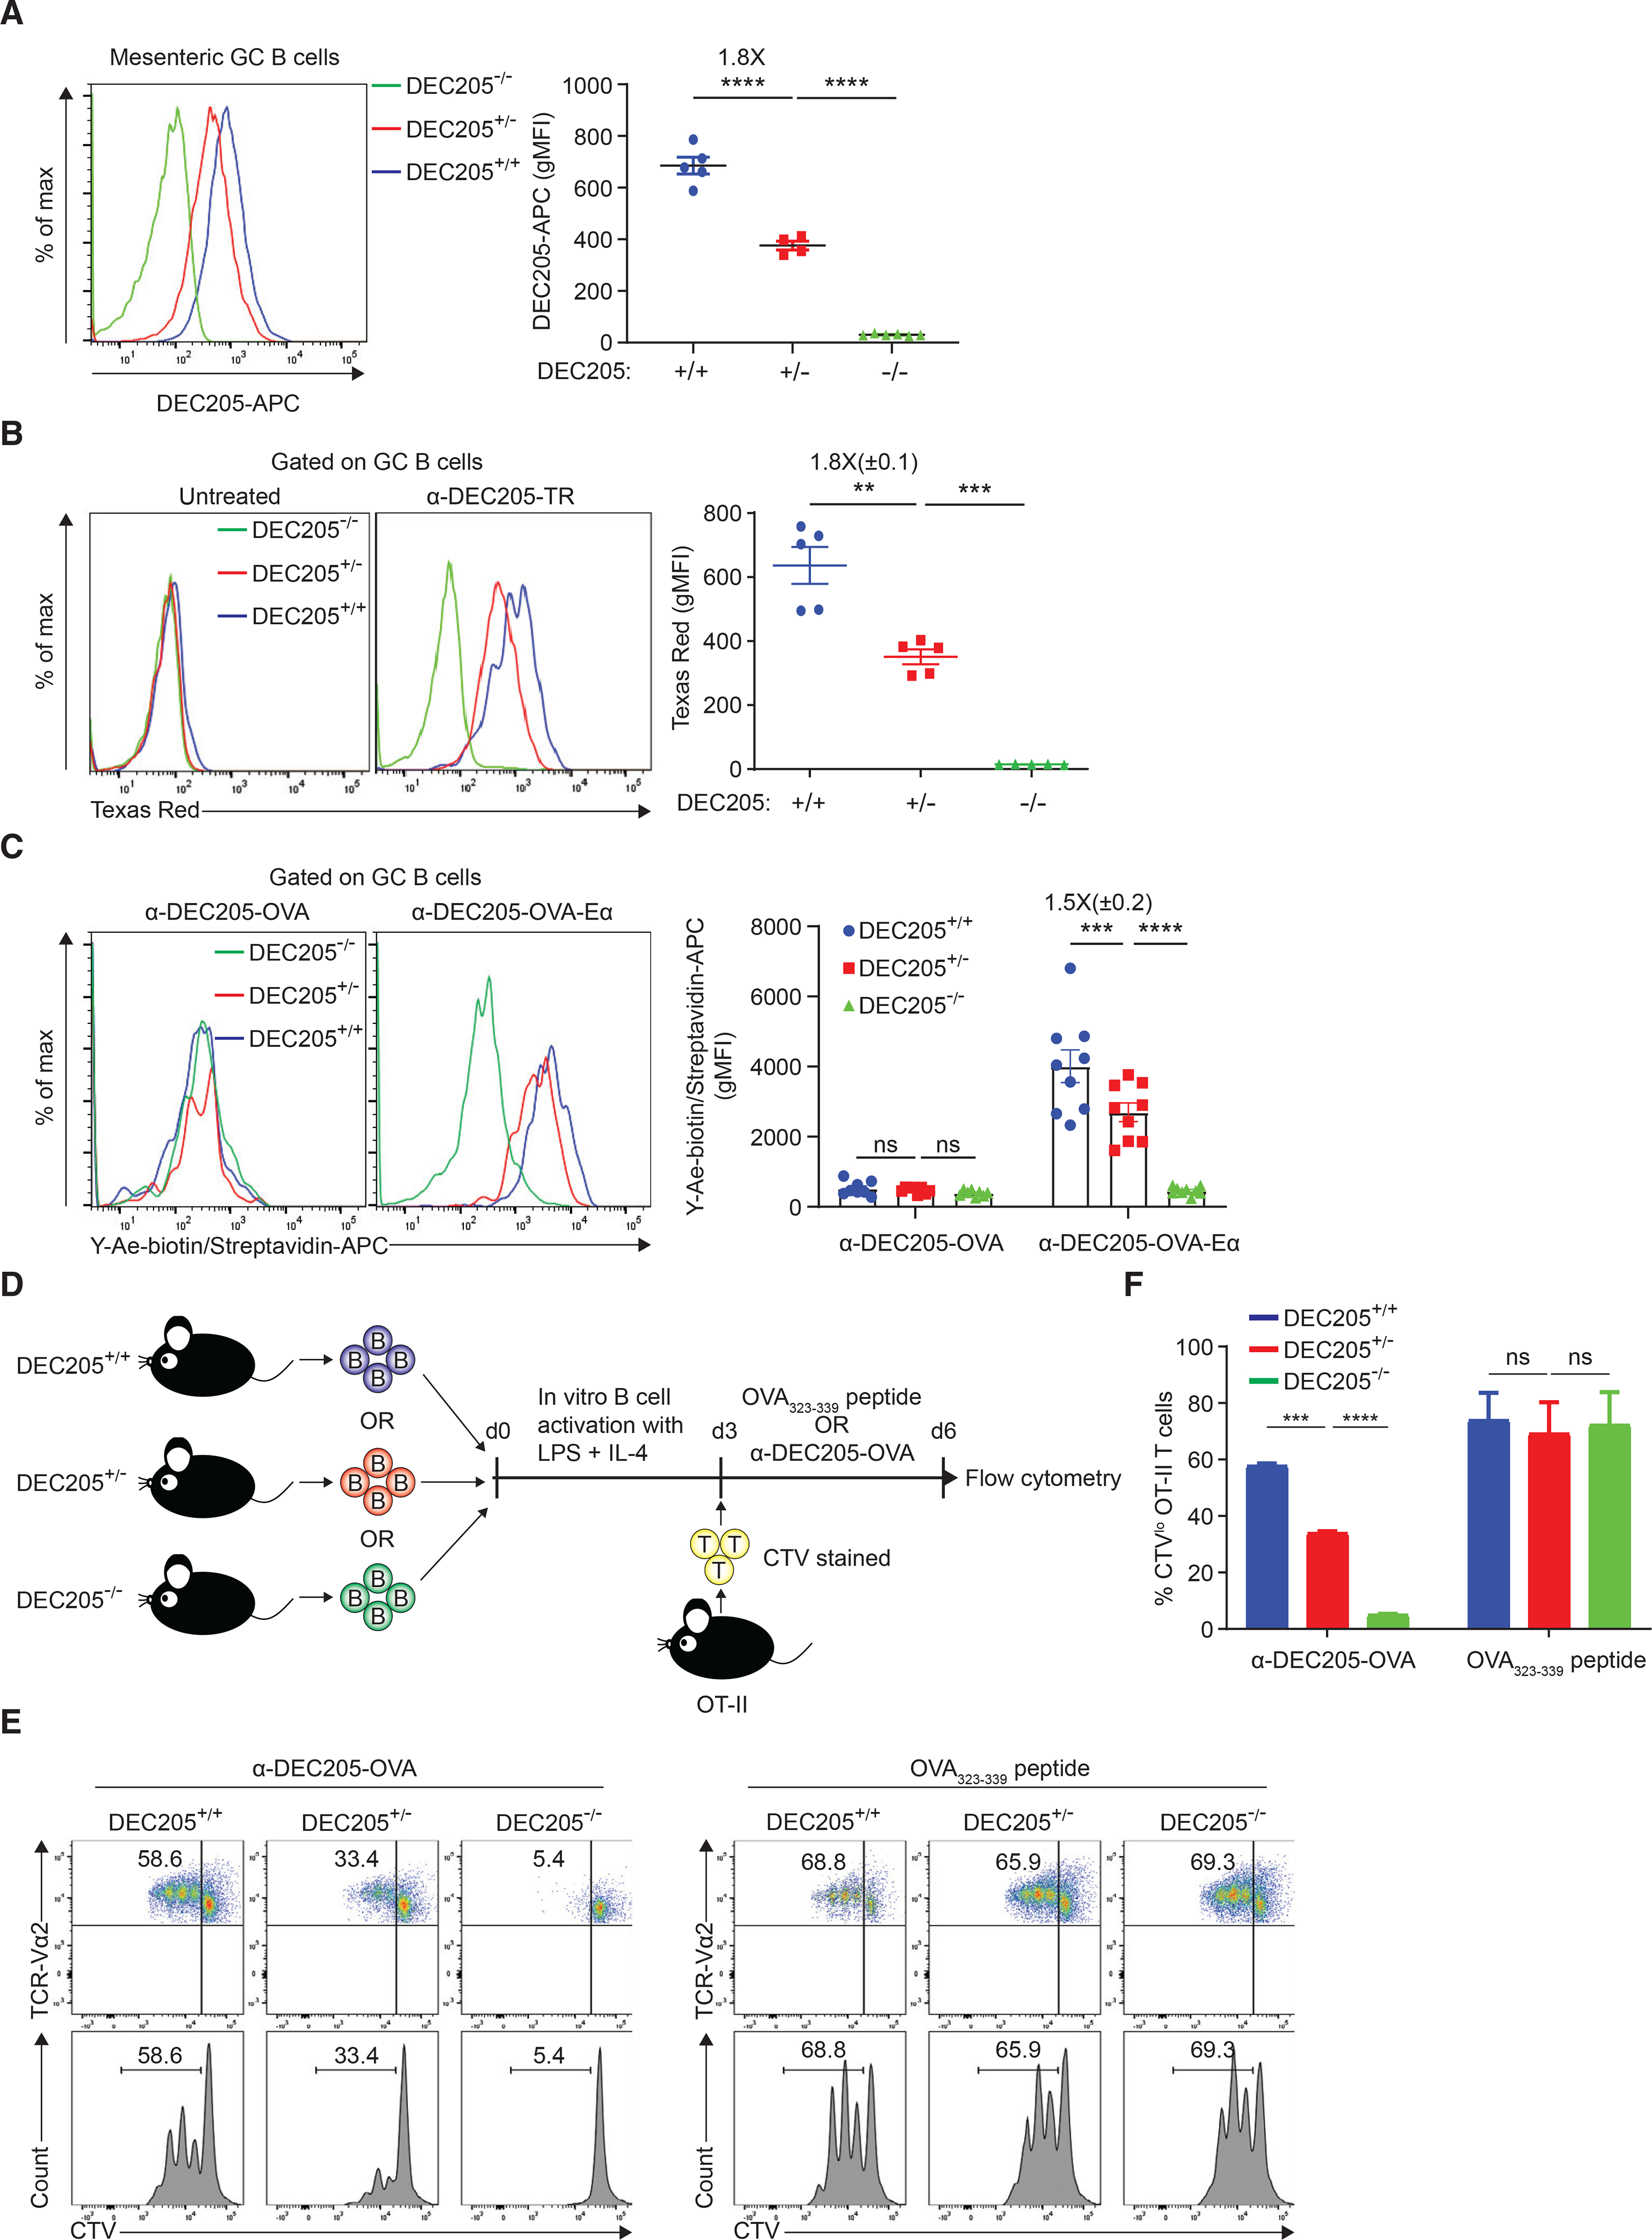
Figure 1. Differential pMHCII density can be controlled by αDEC-OVA targeting.

(A) DEC205 surface expression on GC B cells from mesenteric lymph nodes.
(B) αDEC205-Texas Red uptake level of DEC205+/+, DEC205+/−, and DEC205−/− GC B cells in the draining lymph node.
(C) Y-Ae staining of DEC205+/+, DEC205+/−, and DEC205−/− GC B cells in the draining lymph node.
(D) Experimental setup for (E) and (F).
(E) OT-II T cell proliferation is shown by CTV dilution, which is quantified in (F). Data are representative of two individual experiments. All bars show mean ± SEM. **p < 0.01; ***p < 0.001; ****p < 0.0001; ns, non-significant by unpaired Mann-Whitney U test (A and F) or paired Student’s t test (B and C). All graphs show pooled data from at least two independent experiments. (A) n = 5–6; (B) n = 5; (C) n = 8; (F) n = 2.
