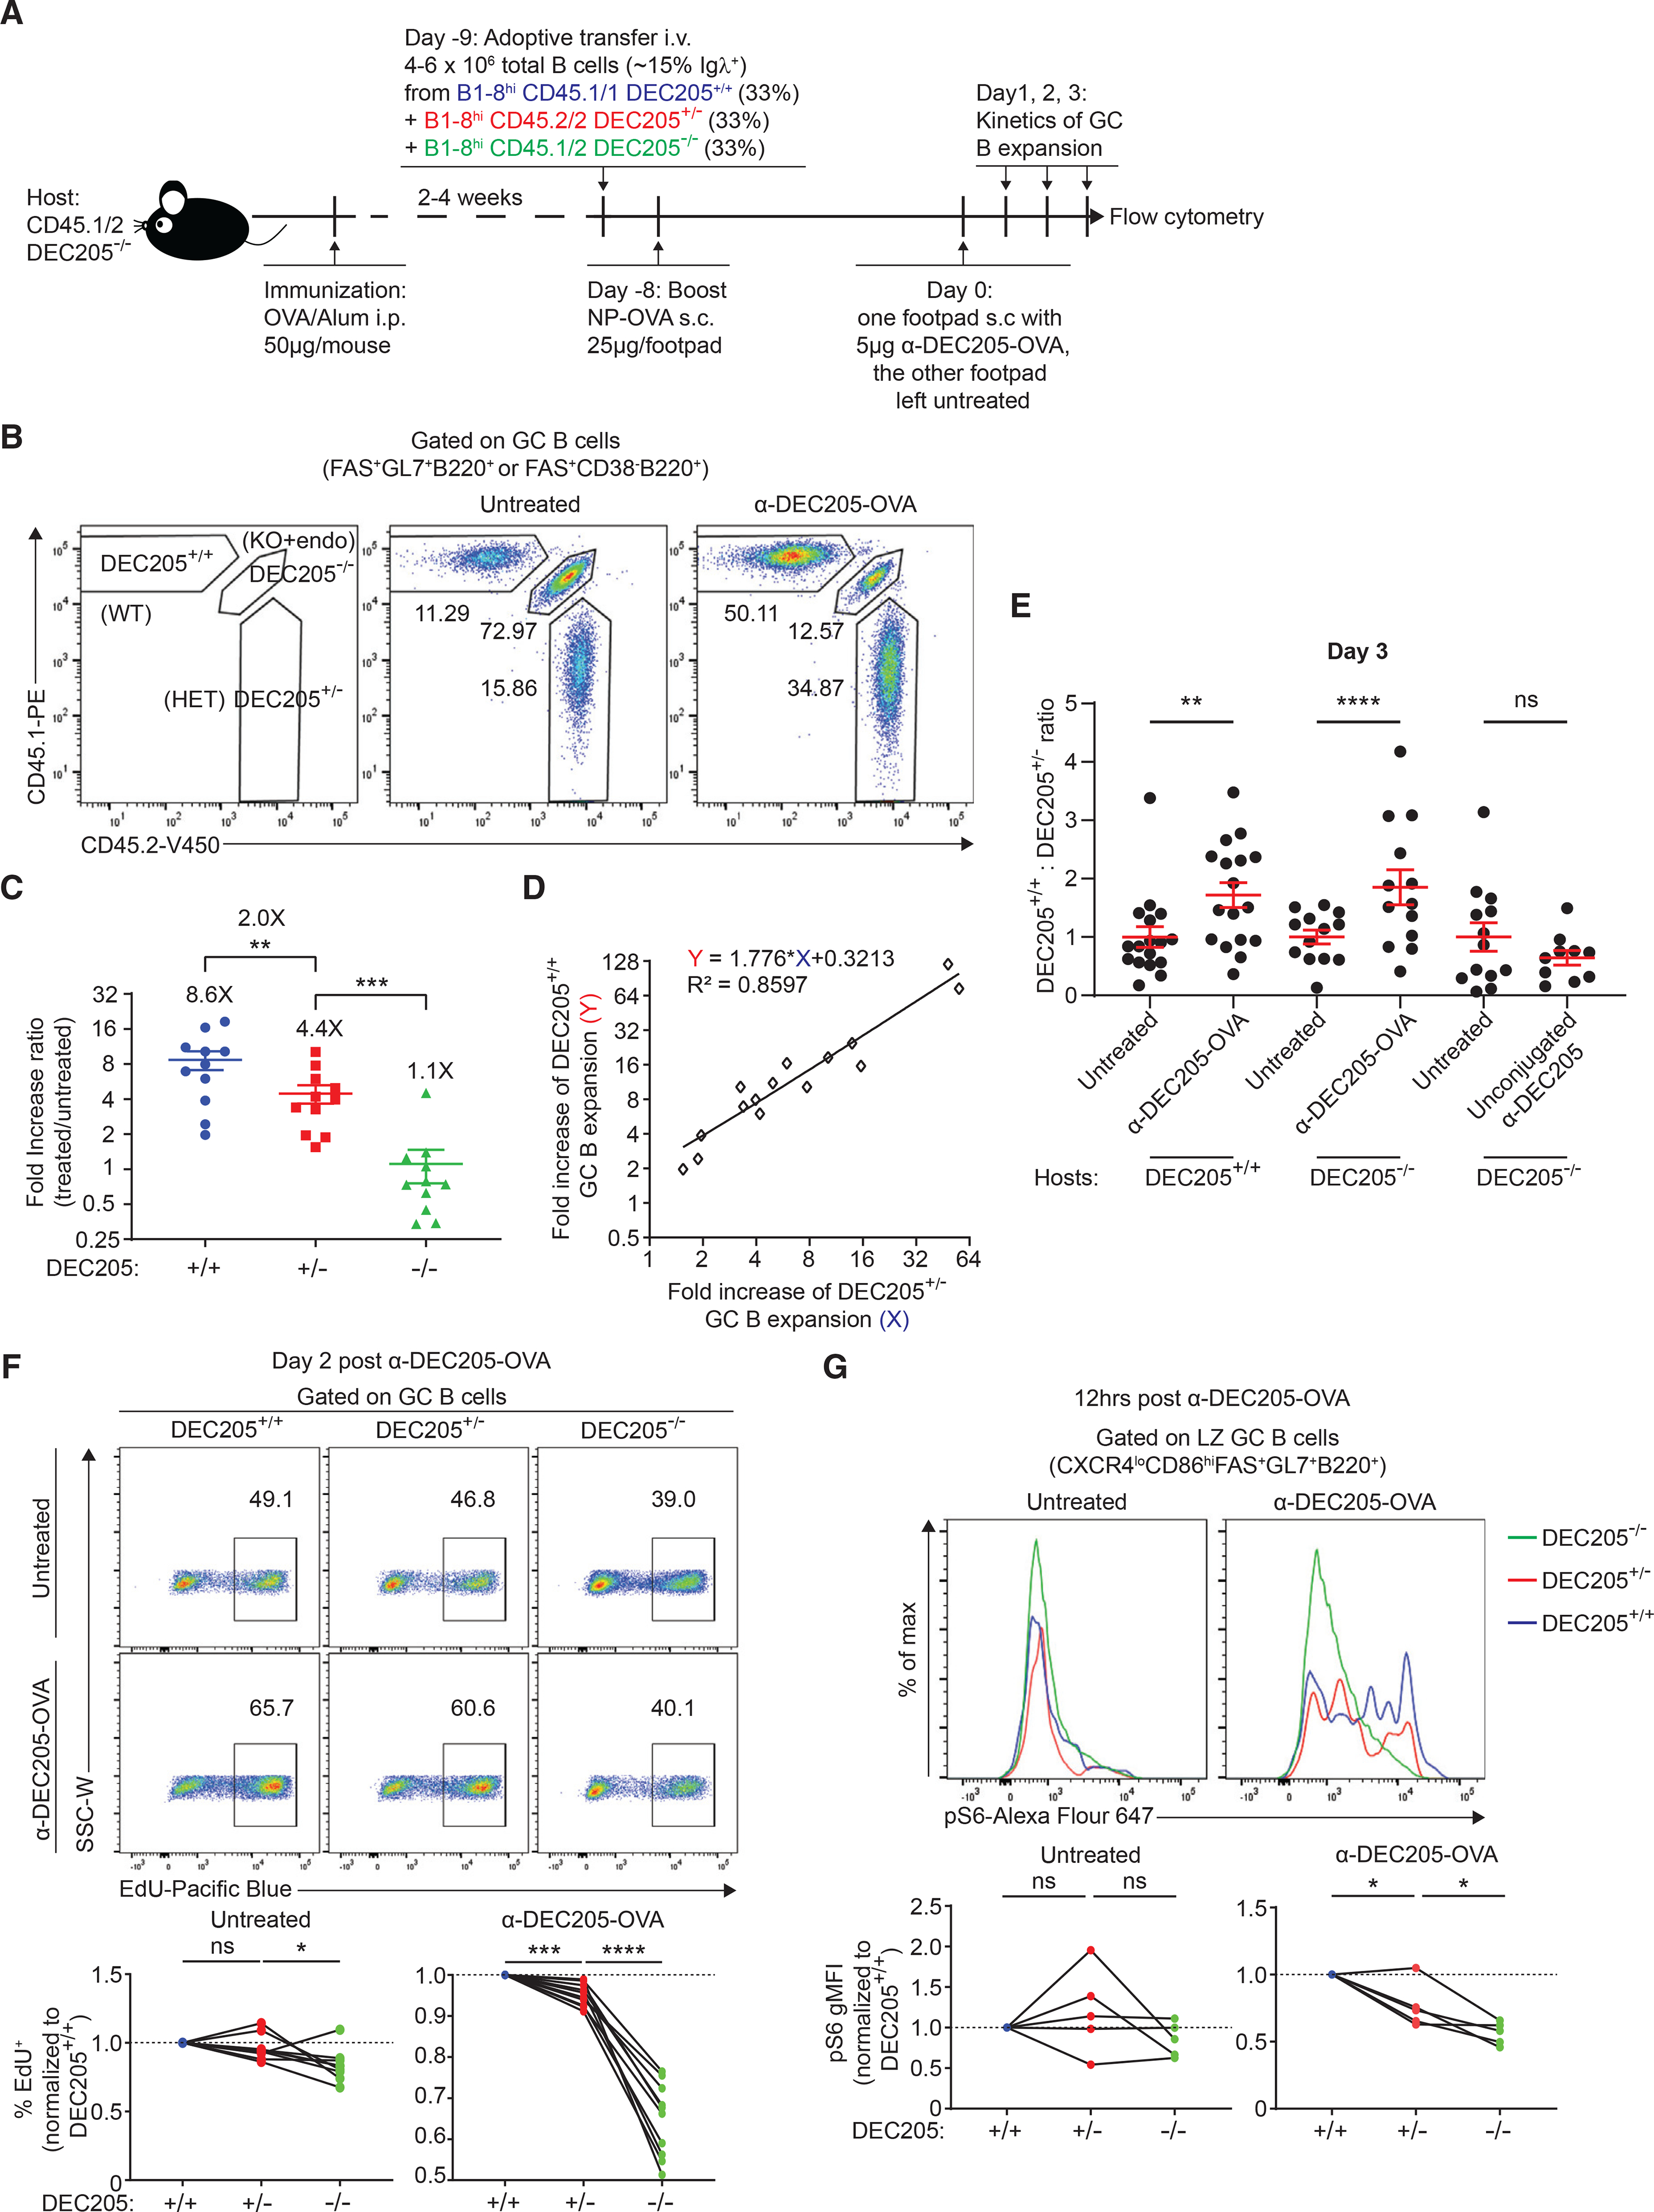
Figure 2. GC B cell clonal expansion magnitude is proportional to pMHCII density.

(A) Experimental setup for (B–E).
(B) Representative plot of FACS staining for differentiating DEC205+/+, DEC205+/−, and DEC205−/− GC B cells, a key of gating each population is shown on the left.
C) αDEC-OVA/untreated fold increase ratio of GC B cell absolute numbers.
(D) Linear association between the fold change of DEC205+/+ and DEC205+/− GC B cell expansion.
(E) The DEC205+/+/DEC205+/− ratio by absolute numbers of GC B cells 72 h after αDEC-OVA or unconjugated αDEC205 treatment compared with untreated contralateral footpad in DEC205+/+ or DEC205−/− hosts.
(F) Normalized EdU incorporation of GC B cell subsets 2 days post αDEC-OVA treatment compared with untreated footpad on the top, which is quantified at the bottom.
(G) Normalized phospho-S6 staining of DEC205+/+, DEC205+/−, and DEC205−/− GC B cells 12 h post αDEC-OVA treatment compared with untreated footpad on the top, which is quantified at the bottom. All bars show mean ± SEM. *p < 0.05; **p < 0.01; ***p < 0.001; ****p < 0.0001; ns, non-significant by paired Student’s t test. All graphs show pooled data from at least two independent experiments. (C) n = 11; (E) n = 13–17; (F) n = 8; (G) n = 5.
