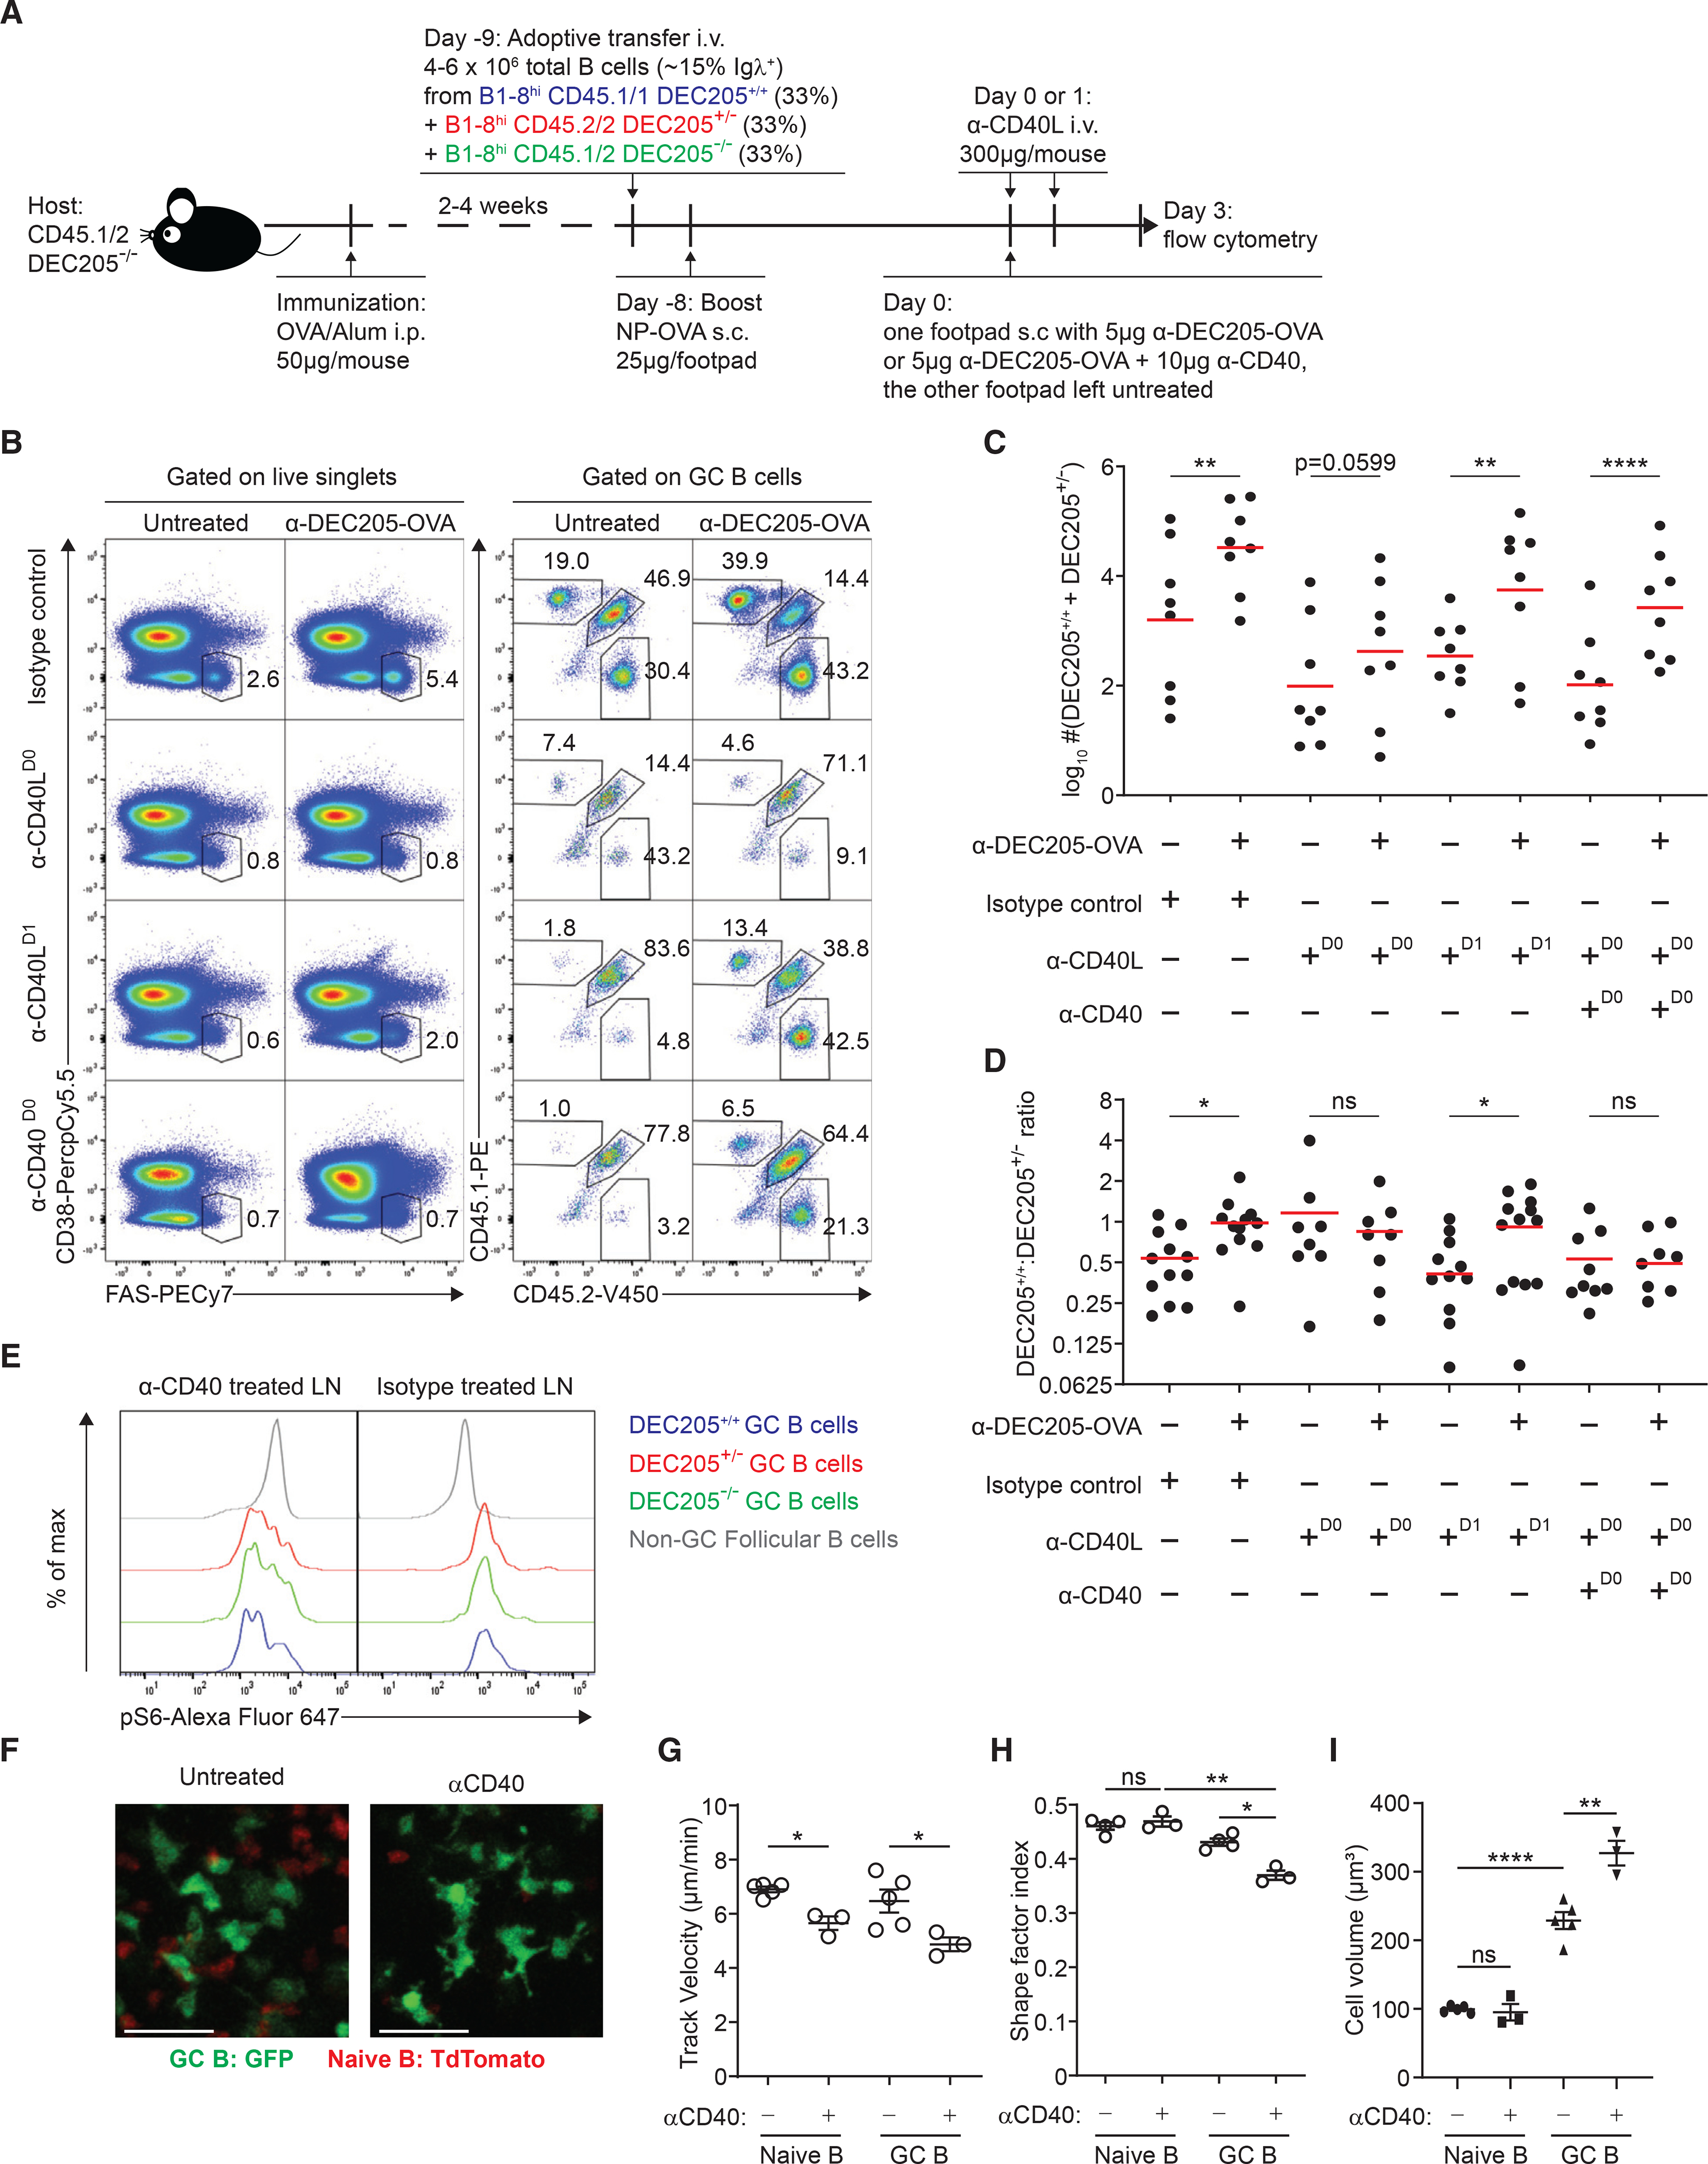
Figure 3. CD40-CD40L signaling strength controls the magnitude of pMHCII-density-dependent clonal expansion.

(A) Experimental setup for direct competition of GC B cells with differential pMHCII density in the presence of CD40-CD40L signaling stimulus or blockade by using agonist αCD40 or antagonist αCD40L.
(B) Representative plot of total GC B cell frequency and frequency of DEC205+/+, DEC205+/−, and DEC205−/− GC. B cells within the GC in the presence of agonist αCD40, antagonist αCD40L, or isotype control with or without αDEC-OVA.
(C) Log-transformed sum of DEC205+/+ and DEC205+/− GC B cell absolute numbers in the presence of agonist αCD40, antagonist αCD40L, or isotype control 3 days after αDEC-OVA treatment.
(D) DEC205+/+/DEC205+/− ratio by GC B cell absolute numbers in the presence of agonist αCD40, antagonist αCD40L, or isotype control 3 days after αDEC-OVA treatment.
(E) Phospho-S6 staining of DEC205+/+, DEC205+/−, and DEC205−/− GC B cells in mice treated with stimulating αCD40 compared with isotype-treated controls.
(F) Example two-photon images of GFP+ GC B cells (green) and tdTomato+ naive B cells in the pLN, with or without agonist anti-CD40. Scale bars, 27 μm.
(G–I) (G) Track velocity, (H) shape factor, and (I) cell volume of transferred GFP+ GC B cells (green) and endogenous tdTomato+ naive B cells (red) with or without agonist anti-CD40 in the GC. All bars show mean (C and D) or mean ± SEM (G–I). *p < 0.05; **p < 0.01; ****p < 0.0001; ns, non-significant or exact p values shown by paired (C and D, G–I) or unpaired Student’s t test (H–I). All graphs show pooled data from at least two independent experiments. (C and D) n = 7–9; (G) n = 3–5; (H) n = 3–4; (I) n = 3–5.
