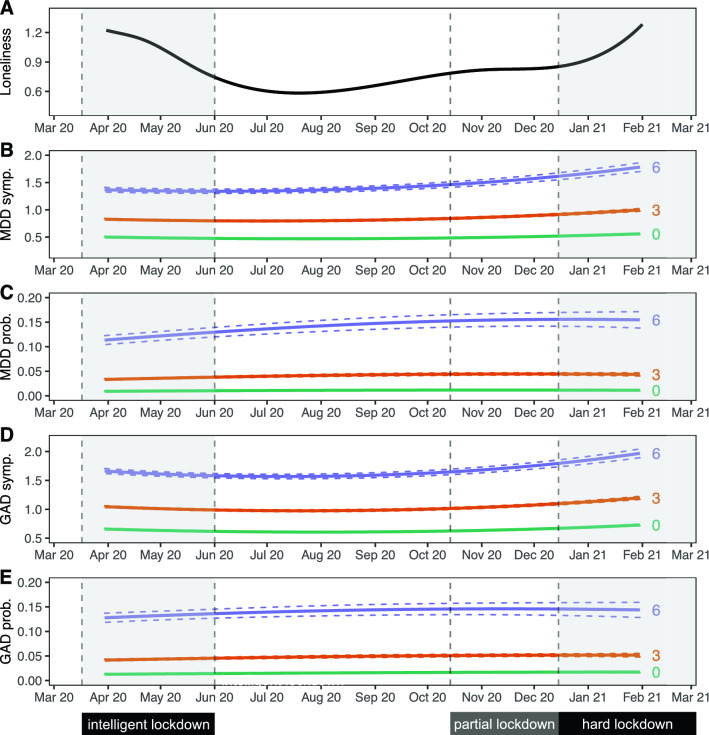
Figure 1.
Trajectories of loneliness and MDD and GAD outcomes over time. Shaded areas represent periods during which lockdown measures were enforced in the Netherlands. The first 'intelligent' lockdown consisted of restrictions such as social distancing and bans on public gatherings. During the partial lockdown, some restrictions were reintroduced. The 'hard' lockdown introduced more restrictions and a curfew. (A) Marginal GEE effect plot of a GEE model of loneliness scores predicted by a polynomial spline time term. The 95% confidence interval of model-predicted values is not visible because the interval is very small. (B–E) Marginal GEE effect plot of predicted counts of MDD symptoms (B), odds of MDD diagnoses (C), counts of GAD symptoms (D) and odds of GAD diagnoses (E) across different levels (0/green; lowest, 3/orange; moderate, 6/purple; highest) of loneliness scores. Predicted values represent symptoms counts and diagnosis probabilities, and are based on main model fits (Tables 2 and 3). Dashed lines represent a 95% confidence interval of model-predicted values.

