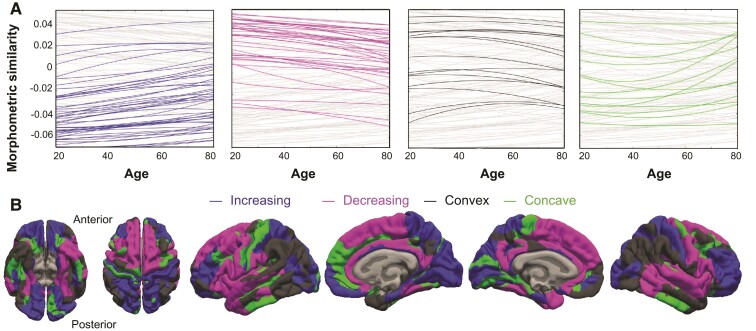
Figure 1.
Cross-sectional trajectories of MS in a normative sample (NKI-RS, Nathan Kline Institute, Rockland Sample). Increasing (blue), decreasing (red), convex (black) and concave (green) trajectories were observed (A), with regions showing particularly high and low mean similarity scores tending towards zero with increasing age. All trajectories are plotted in the background in grey. The anatomical distribution of increasing, decreasing, convex and concave trajectories is shown in (B).

