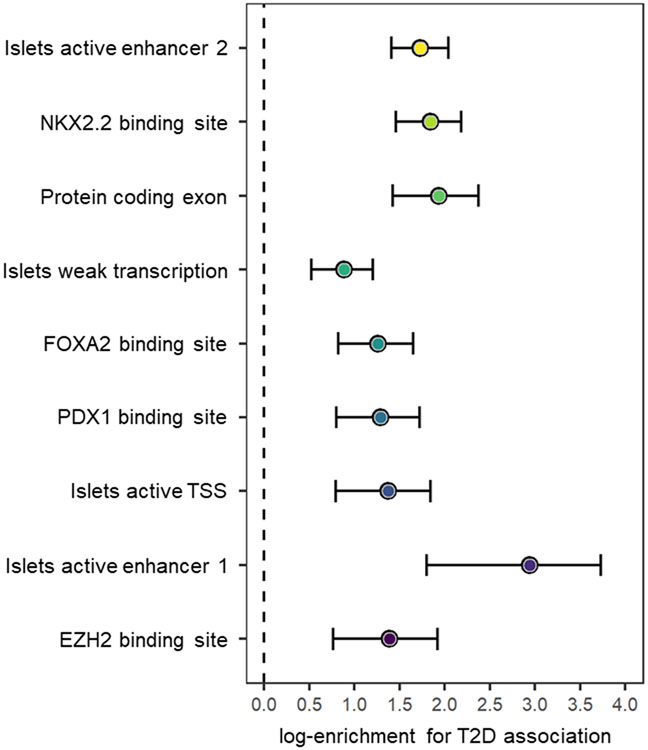
Extended Data Fig. 6. Summary statistics from joint fGWAS model of enriched functional and regulatory annotations across distinct T2D association signals from multi-ancestry meta-regression (MR-MEGA) of up to 180,834 cases and 1,159,055 controls.
Each point corresponds to an annotation, plotted for the log-enrichment for T2D association on the x-axis, with bars representing the corresponding 95% confidence interval (CI).

