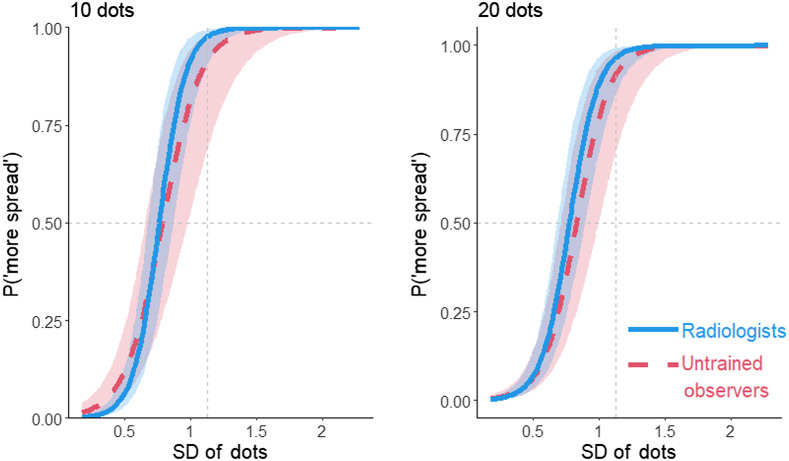
Fig. 4.
The proportion of more spread responses in the dot task as a function of the SD of the dots, participant group, and number of dots (10,20). The vertical gray dashed line indicates the POE. Curves that intersect the horizontal gray dashed line to the left of the vertical dashed line show a bias to overestimate spread. Shading represents 95% CIs calculated from the model.

