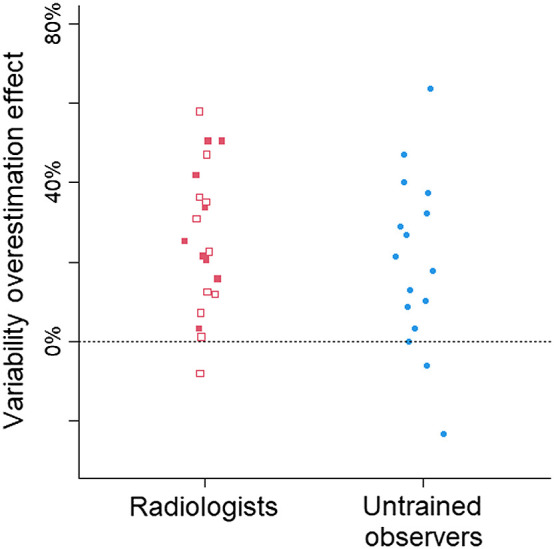
Fig. 5.

The variability overestimation effect in the dot task, collapsed across number of dots and grouped by participant group. Each symbol corresponds to the bias in one participant. Open symbols correspond to radiologists who spend at least some of their clinical time on mammograms. The horizontal dashed line at 0 indicates no bias. Positive scores indicate a bias to overestimate the spread of the dots, and negative scores indicate a bias to underestimate.
