Fig. 8.

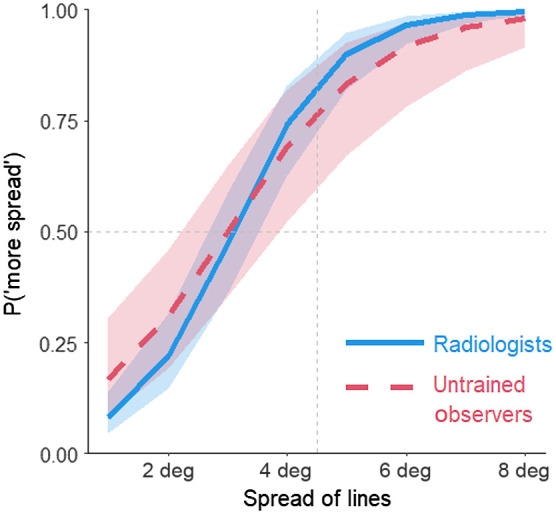
Estimated spread in the line task as a function of the spread of the lines (in degrees) and participant group. Shading represents 95% CIs calculated from the model.

Estimated spread in the line task as a function of the spread of the lines (in degrees) and participant group. Shading represents 95% CIs calculated from the model.