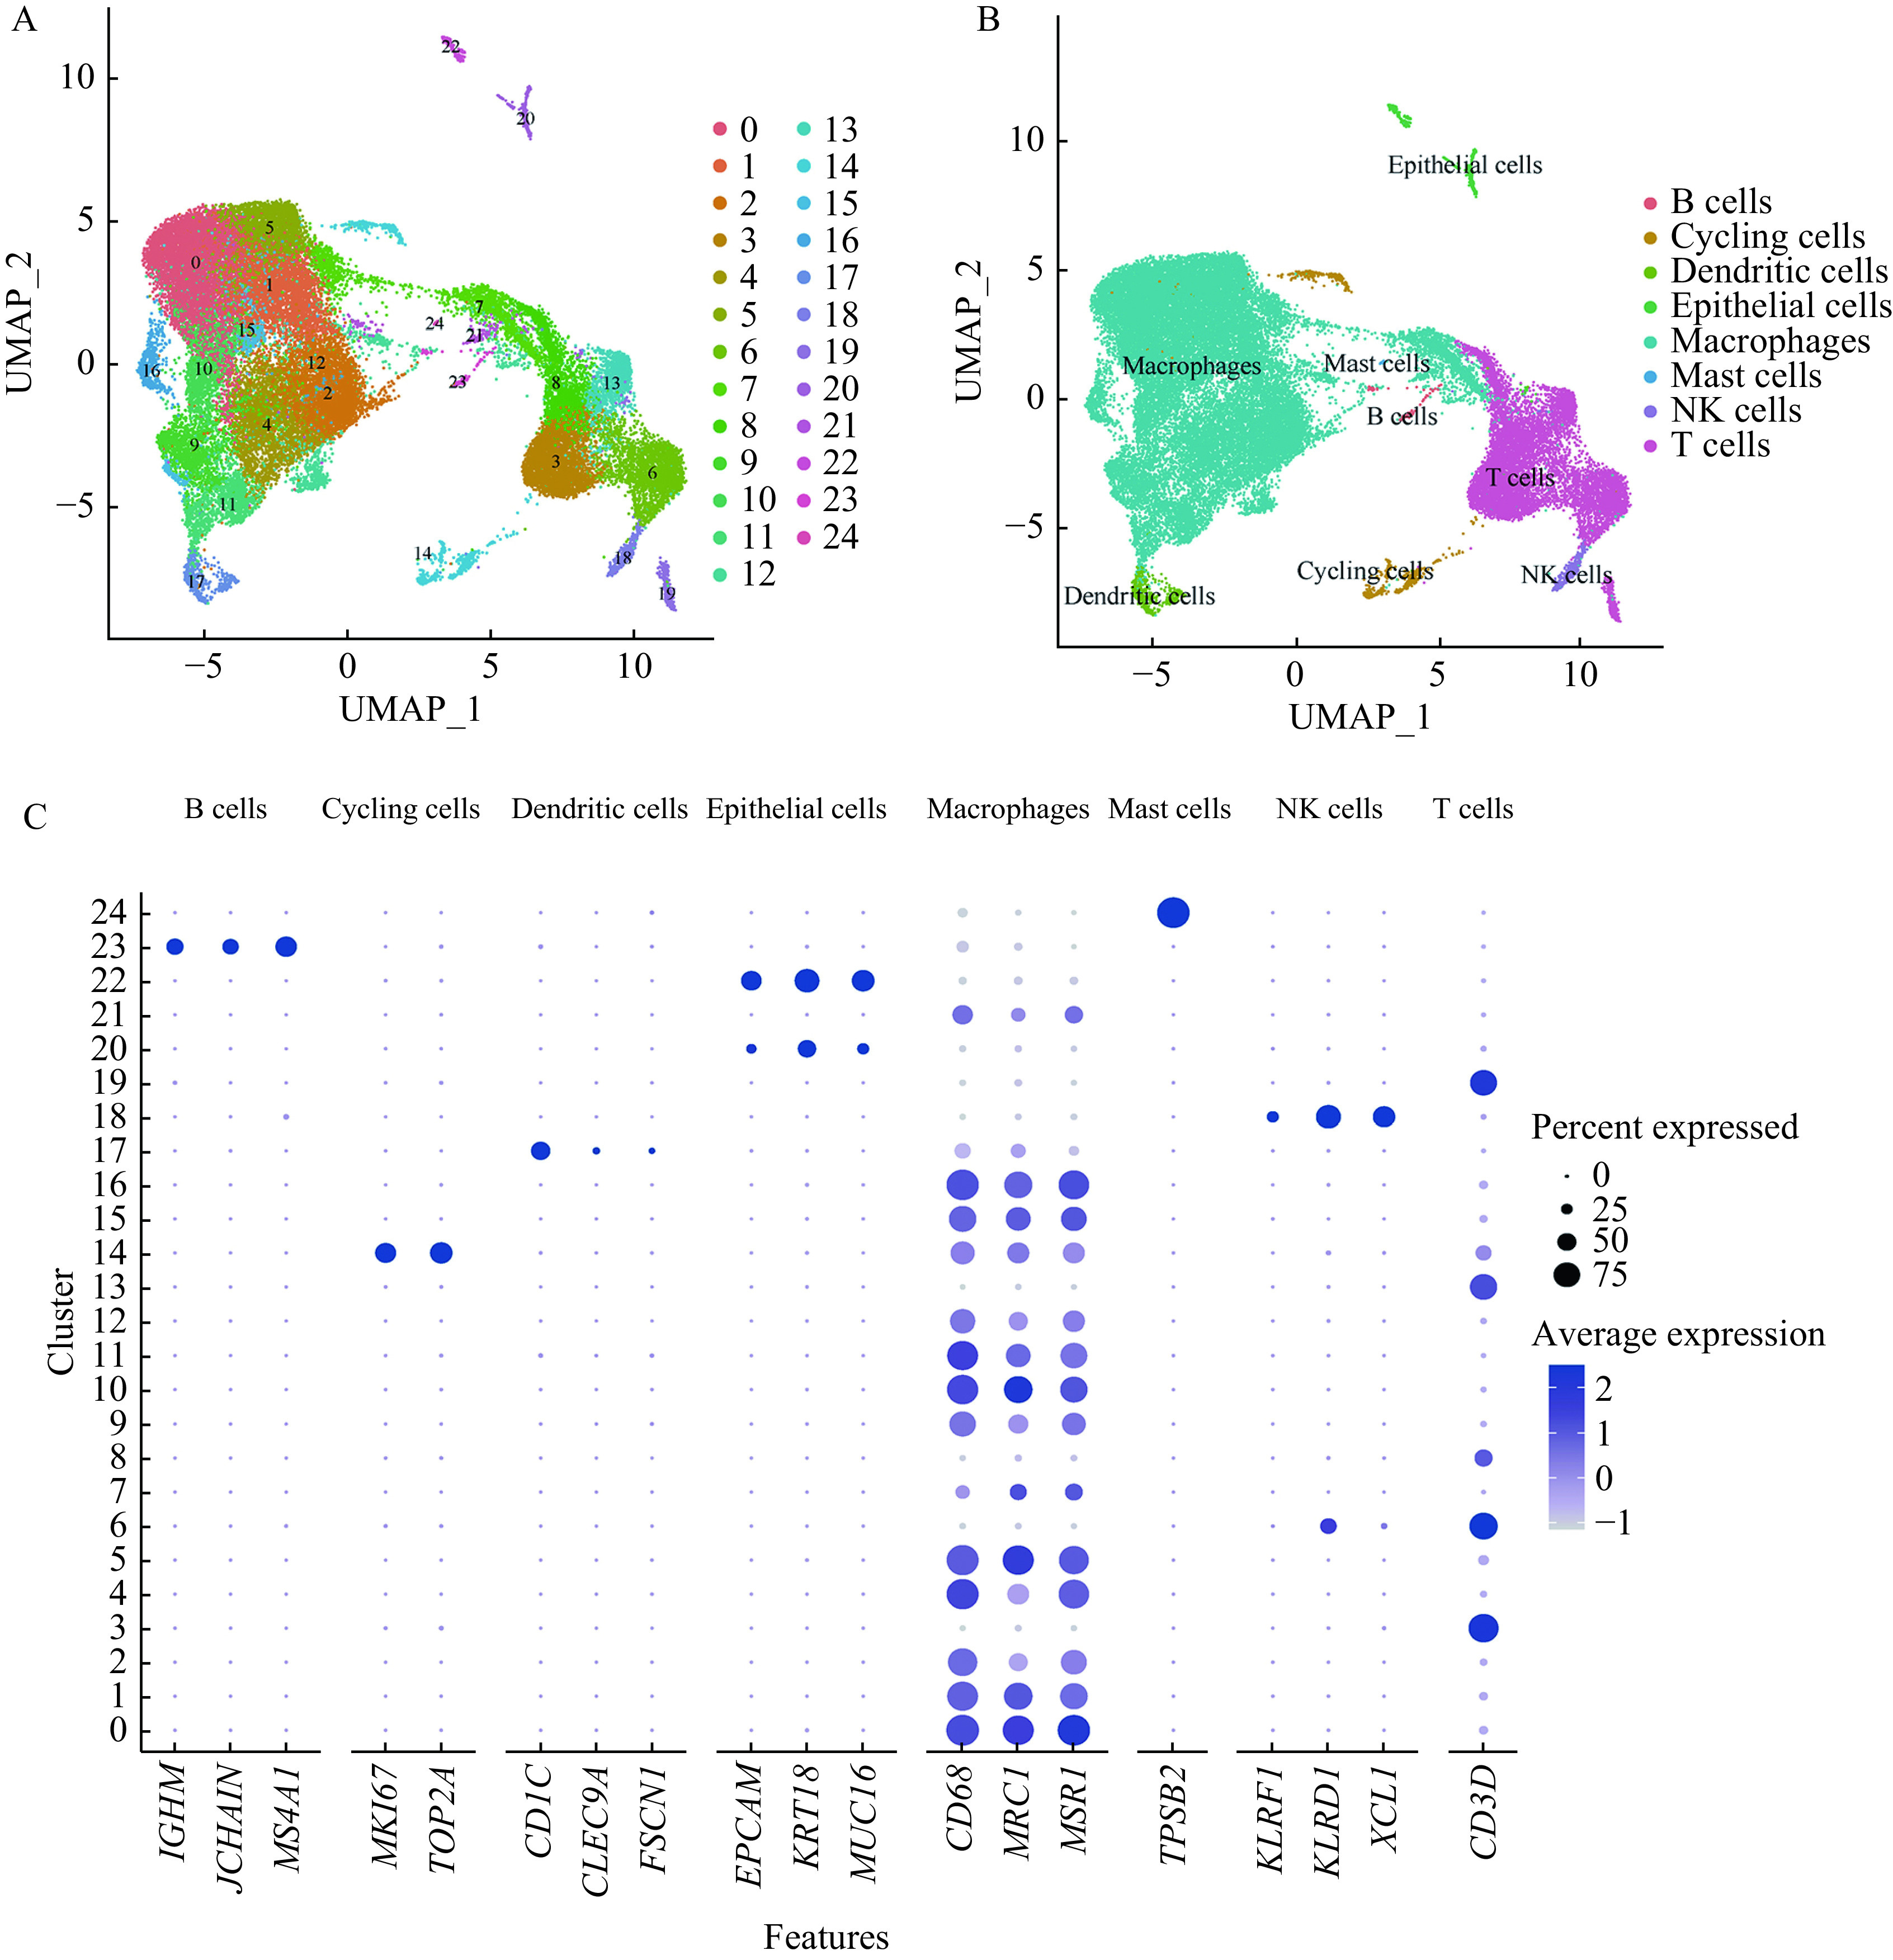
Figure 1.

Single cell transcriptional profiling of BALF cells.
A: UMAP plot of 25 identified clusters in BALF cells. Different colors specify assignment of 25 clusters by nearest neighbor clustering. B: UMAP plot of the 8 cell types annotated by the transcriptional cell markers. C: Dot plot describing expression levels of the marker genes of each cell type where the X-axis represents gene markers and the Y-axis represents the clusters in panel A. The dot size refers to the percentage of cells expressing the gene of each cluster. The color intensity is related to the average log-normalized gene expression of each cluster. UMAP: Uniform Manifold Approximation and Projection; BALF: bronchioalveolar lavage fluid.
